Alert sources
Connect a tool to ilert, then decide what its events mean: who gets paged, how urgent it is, and which events are worth an alert at all.
An alert source is the connection between one of your tools and ilert — a monitoring system, a ticketing tool, an application. Events arrive at it, and it decides what they mean: whether they become an alert at all, how urgent that alert is, and who gets woken up.
Almost everything about how an alert behaves is set on the alert source, not on the alert. If ilert is paging too often, too quietly, or the wrong person, this is the screen to open.
Ways to send events
Your tool is one of the 200-plus ilert has built an integration for. Pick it in the wizard and you get parsing, grouping keys and resolve handling for free.
The tool can only send mail. The alert source gets its own address; forward to it.
You are writing the integration yourself.
You want an alert when a signal stops arriving, rather than when one arrives.
SMS
A device or system can only send a text message. An add-on on Scale and Enterprise, provisioned by ilert rather than created in the wizard.
Missing a tool? Suggest an integration — or use the Events API in the meantime.
Create an alert source
Name it
Use a name that says which system and which environment — Prometheus (prod) beats Prometheus. Optionally assign teams, which controls who can manage it.
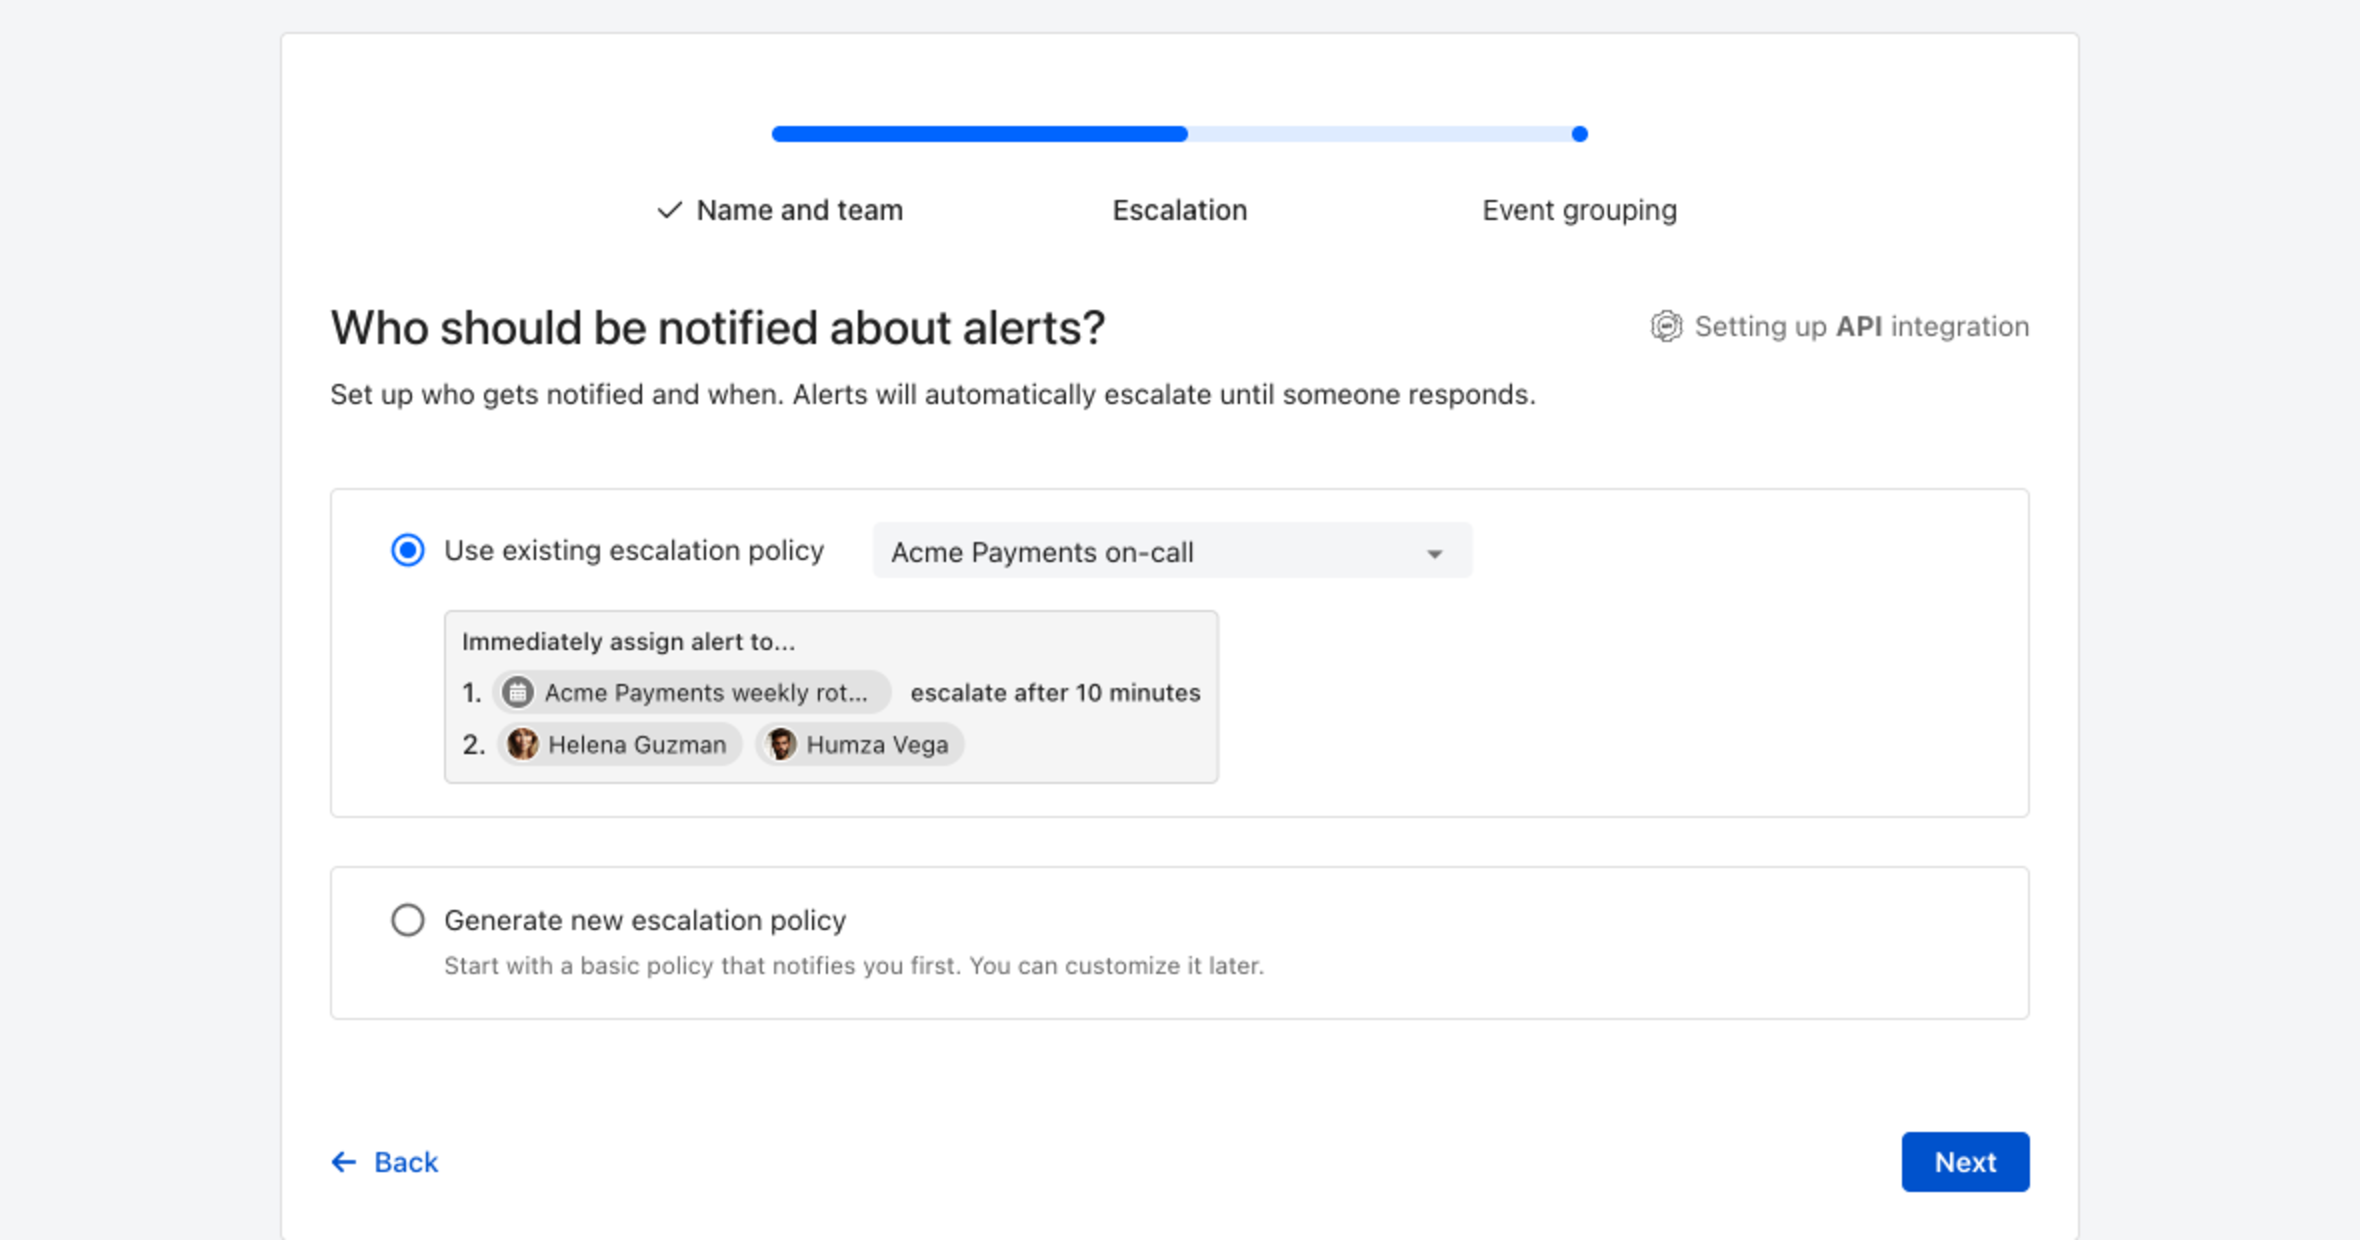
Choose who gets notified
Pick an escalation policy, or create one here. It feels like the decision you have to get right; it is not, and you can change it whenever.
Choose how to group events
Default grouping, Time-based or Group by content similarity. Pick Default for now — grouping is easier to judge once you have seen what the source actually sends.

What an alert source decides
Opening an alert source shows one long form. It reads as a flat list of settings, but it is really five separate jobs, and it helps to know which one you are doing:
Escalation
Who gets this?
Alert template
What will the alert say?
Notification priority, Alert severity, Affected services
How urgent is it, and what does it touch?
Reduce noise
Should this event become an alert at all?
Custom processing rules
How should ilert read this payload? (Rarely needed.)
Escalation
The escalation policy chosen here applies to every alert this source creates — unless a routing key says otherwise.
Dynamic escalation policy routing
Instead of one fixed policy, you can let the event choose. Under Escalation → Dynamic routing, give a template that extracts a value from the payload; ilert matches that value against the routing keys defined on your escalation policies.
If several routing keys are sent (comma-separated), ilert evaluates them left to right and uses the first that matches. If none match, the source's own escalation policy is used — so a broken template degrades to the default rather than dropping the alert.
This is how one Prometheus alert source can page the database team for database alerts and the platform team for everything else.
Alert template
By default an alert's summary and details come from ilert's built-in template for that integration.
Custom alert summary and details template
Enable Alert summary or Alert details to write your own. The editor offers fields in three colours, and the distinction matters:
Blue
Preset fields ilert defines for this integration
Orange
Fields ilert has actually seen in past events from this source
Grey
Anything else in the JSON payload — type the path yourself, e.g. custom_field.array_field[5].nested_field
Use Preview before saving. ilert renders your template against a recent real payload from this source, or against a fallback JSON document you can edit if the source has never received anything.
Text mode accepts {{ variable }}, including nested paths and array indexes. For conditionals, loops and functions, see ITL — the ilert template language.
Alert links
Extract alert links from the alert payload pulls URLs out of the event and puts them in the alert's links section — a dashboard, a runbook, the originating ticket. One click from the page to the thing that explains it.
Priority, severity and affected services
Three settings, three different jobs. They are easy to confuse because they sit next to each other.

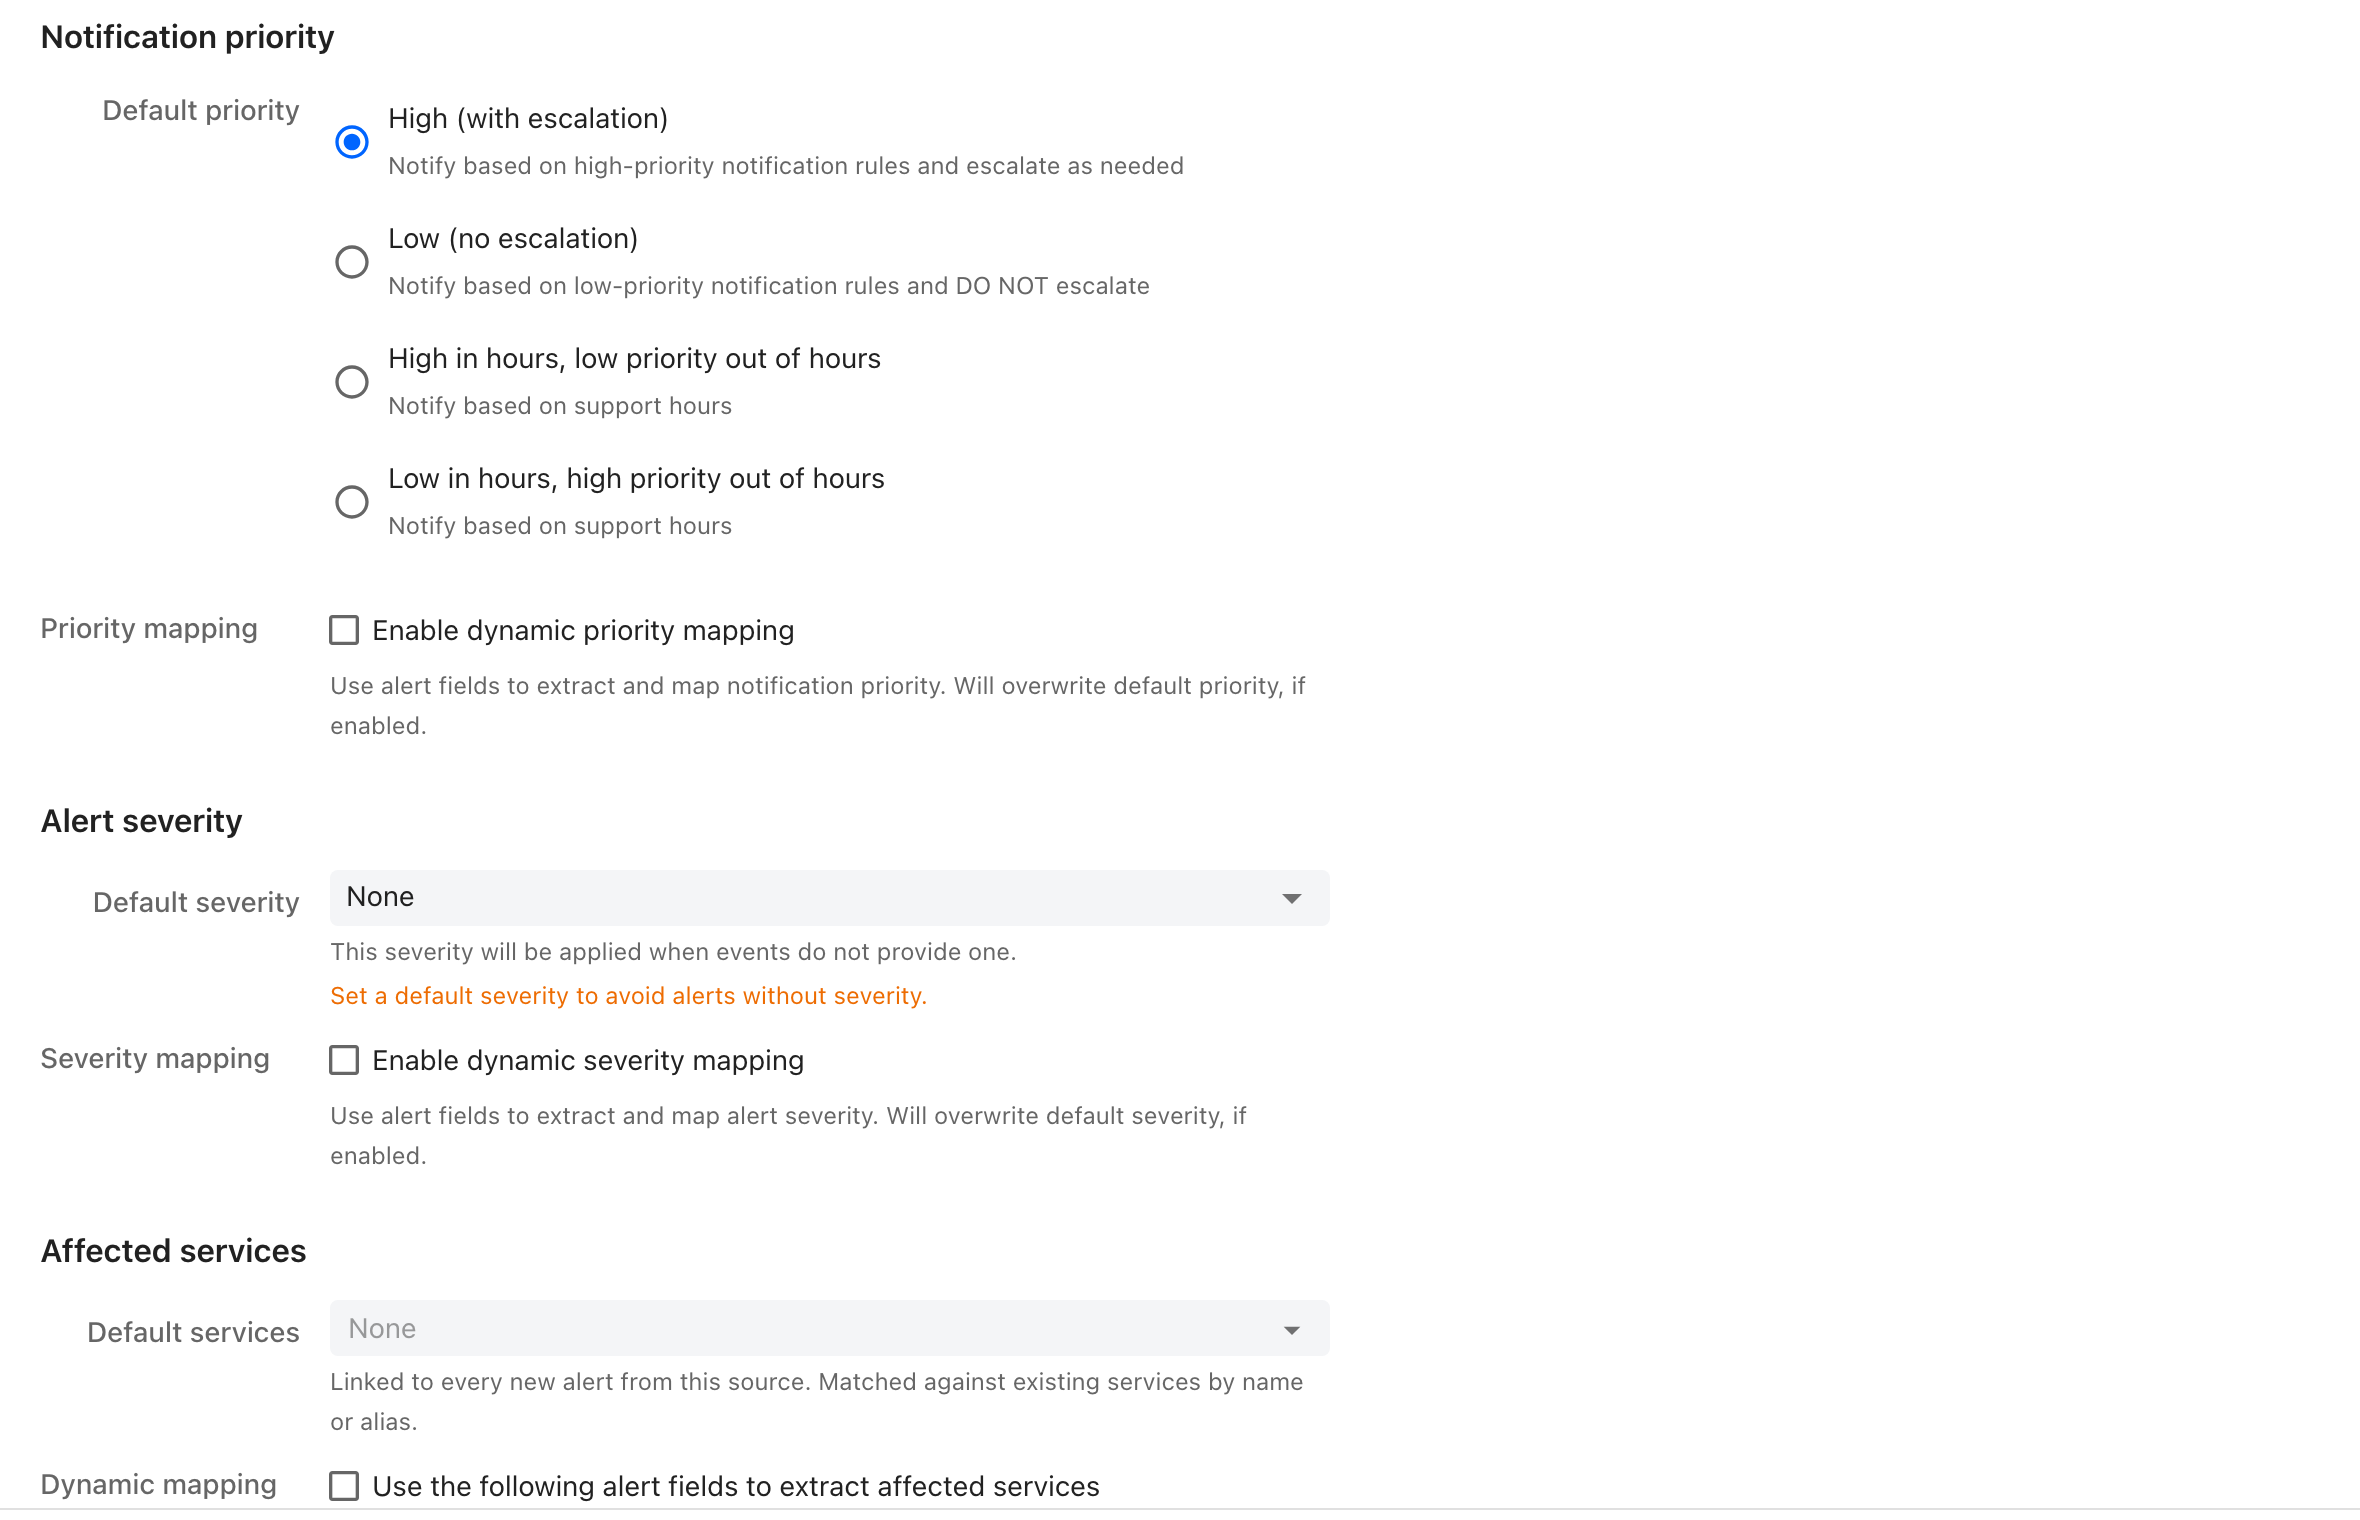
Notification priority
Priority decides which of your notification rules fire, and whether the alert escalates at all:
High (with escalation) — uses your high-priority notification rules, and escalates through the policy.
Low (no escalation) — uses your low-priority rules, and never escalates. It stops at the first escalation rule.
The other two options hand the decision to your support hours:
High during support hours, low priority otherwise
Low during support hours, high priority otherwise
Either way, ticking Raise priority of all pending alerts will lift alerts that are still open when the window flips — at the start of support hours for the first option, at the end for the second.
Alert severity
Severity is a label describing how bad the problem is: SEV1 Critical, SEV2 Major, SEV3 Moderate, SEV4 Minor, SEV5 Info. It does not change who is notified.
Set a Default severity so alerts from this source are never severity-less, and enable Severity mapping to translate your tool's own vocabulary — critical, P1, page — onto ilert's.
Affected services
Link alerts from this source to services automatically, either by naming defaults or by extracting a field from the payload. ilert matches extracted values against existing services by name or alias, so an alias is usually easier than renaming a service to match your monitoring.
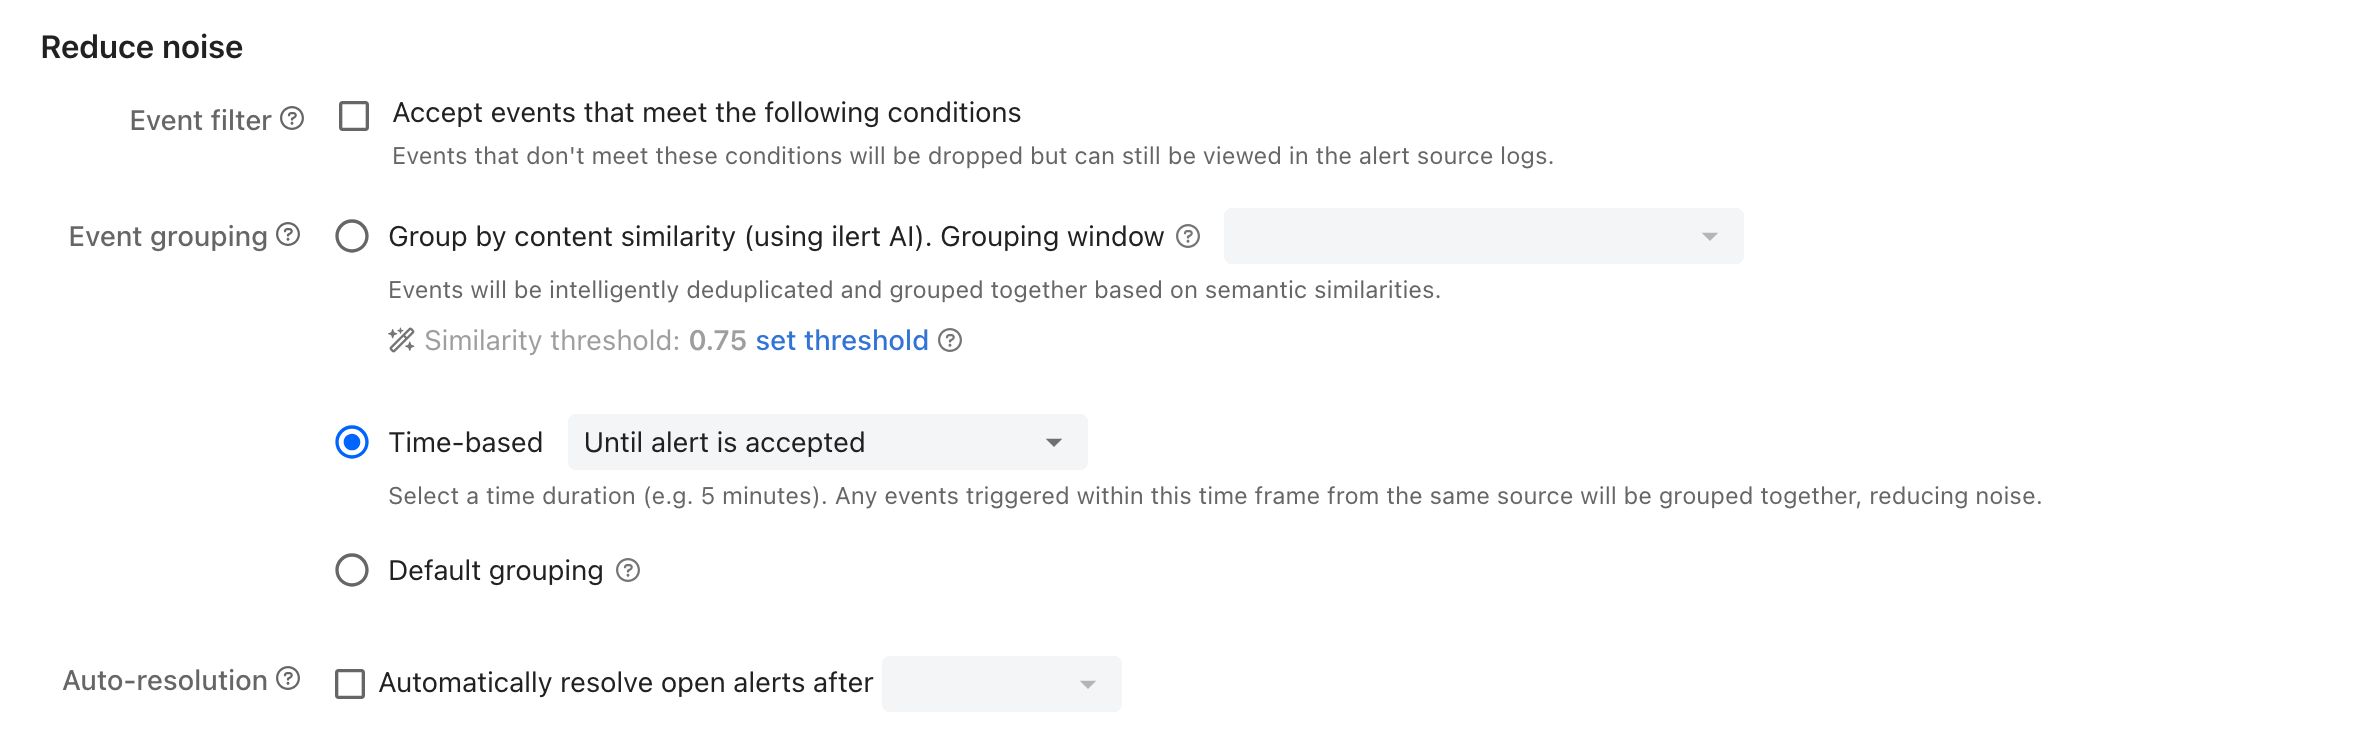
Reduce noise
This section is where most of the value is. An alert source that pages on everything gets ignored within a week.

Event filter
Accept events that meet the following conditions — anything else is dropped before it can become an alert. This is the tool for Grafana DatasourceNoData and its cousins.
Dropped events are not lost: they still appear in the alert source logs, so you can check what you filtered out before you trust the filter.
Conditions can use ilert event properties (priority, summary), custom payload fields, support hours and schedules — and trigger counts, which let you say only alert me if this happens five times in five minutes. Switch the builder into code mode for the full ICL — ilert condition language.
Event grouping
Three choices, and they answer different questions:
Default grouping
The alert key the integration provides. Events with the same key join the open alert.
Time-based
Arrival time from the same source — either a window you pick, or Until alert is accepted / Until alert is resolved.
Group by content similarity (using ilert AI)
What the events say, using semantic similarity. See Using ilert AI for alert grouping.
Default grouping is not "no grouping". Integrations with rich payloads — Prometheus, Grafana, Jira, Autotask — supply an alert key and event types, and ilert uses them to fold repeat events into the open alert automatically. Whether a given integration can do this is shown as Alert resolution and Alert acknowledgement in the creation wizard and on the alert source itself.
Time-based grouping stacks on top of that, and its window is rolling: it extends with each new event, up to 24 hours from the first.
Auto-resolution
Automatically resolve open alerts after a duration you choose. Useful for sources that raise alerts but never send a resolve event — an alert nobody closed is indistinguishable from an alert nobody noticed.
Custom processing rules
Under Advanced settings. Change these only when the integration's defaults do not fit:
Alert key — override which fields identify an open alert, and therefore what groups with what.
Create alert rule / Accept alert rule / Resolve alert rule — conditions that decide when a payload means open, acknowledged or fixed. This is how you teach ilert to read a webhook that carries its own state field.
What your plan includes
Escalation policy, dynamic routing, notification priority, severity, affected services
Free
Time-based grouping, including until accepted and until resolved
Pro
Scale
Threshold-based event filters (trigger counts)
Scale
Support hours, and the two support-hours priority options
Scale
See ilert pricing for the full comparison. Plan defaults can be overridden for an individual account, so if a setting is available to you that this table says should not be, that is why.
FAQ
How many alert sources should I create?
One per tool per environment is a good default. The alert source is the unit of grouping, filtering and escalation, so splitting prod from staging lets you page on one and not the other without writing a single condition.
An event arrived but no alert was created. Where did it go?
Alert source logs. Every event is recorded there, including the ones an event filter dropped and the ones that were grouped into an alert that was already open.
Can I change the escalation policy without breaking open alerts?
Yes, and the two ways of "changing" it behave differently. Pointing the alert source at a different policy leaves open alerts on the one they were created with — only new alerts use the new policy. Editing the rules inside a policy affects alerts that are escalating through it right now.
What is the difference between priority and severity?
Priority controls notification: high pages you and escalates, low does neither. Severity is a description of impact that travels with the alert into incidents and reports. Changing severity never changes who gets called.
Why is a setting greyed out with an Upgrade prompt?
It is not in your plan. See what your plan includes.
Last updated
Was this helpful?