> For the complete documentation index, see [llms.txt](https://docs.ilert.com/llms.txt). Markdown versions of documentation pages are available by appending `.md` to page URLs; this page is available as [Markdown](https://docs.ilert.com/alerting/working-with-alerts/dashboard.md).
# Dashboard
Build pages of widgets for open alerts, who is on call, open incidents, service health and metrics, and choose who can see and change them.
A dashboard is a page of widgets that shows at a glance what you would otherwise check one screen at a time: how many alerts are open, who is on call, which incidents are in progress, and how your services are doing. You can keep several, for yourself or shared with everyone in your account.
To open it, click the grid icon at the left end of the top bar, next to **Alerts**. It opens on the dashboard you looked at last. To switch to another, click the arrow to the left of the dashboard's name.
## Create a dashboard
{% stepper %}
{% step %}
### Start a new one
Click the arrow to the left of the current dashboard's name, and choose **Create new dashboard** at the bottom of the list.
{% endstep %}
{% step %}
### Name it and choose who sees it
Enter a **Name**, and pick **Private**, or **Public** with **View only** or **View and edit**. See [Who can see and change a dashboard](#who-can-see-and-change-a-dashboard). Click **Create new dashboard**.
{% endstep %}
{% step %}
### Add widgets
The new dashboard opens in edit mode. Click **Add**, choose a widget, and set it up with the gear icon in its top-right corner.
{% endstep %}
{% step %}
### Save
Click **Save**. ilert saved the empty dashboard when you created it, but saves its widgets and layout only now.
{% endstep %}
{% endstepper %}
## Widgets
| Widget | Shows | Its own settings |
| ------------------------- | ------------------------------------------------------------------------------------------------------------ | ----------------------------------------------------------------------------- |
| **Open alerts** | The number of pending and accepted alerts | **Include merged alerts** |
| **On-call now** | Who is on call for each escalation policy, and how long their shift has left | **Select escalation level**: which level of each policy to show, from 1 to 10 |
| **Open incidents** | [Incidents](/incidents-and-status-pages/incidents.md) that are investigating, identified or monitoring | None |
| **Services** | Each [service](/incidents-and-status-pages/services.md) with its status and its uptime over the past 30 days | None |
| **Metrics** | Your [metrics](/incidents-and-status-pages/metrics.md) as graphs | **Default time range**: Day, Week or Month |
| **Recent alert activity** | The newest entries from alert timelines | **Select timeline events to display** |
**Recent alert activity** can show alert source events, call routing events, connector events, alert updates, notifications and, where your account has them, incident communications. All of them are selected at first.
### Choose what a widget covers
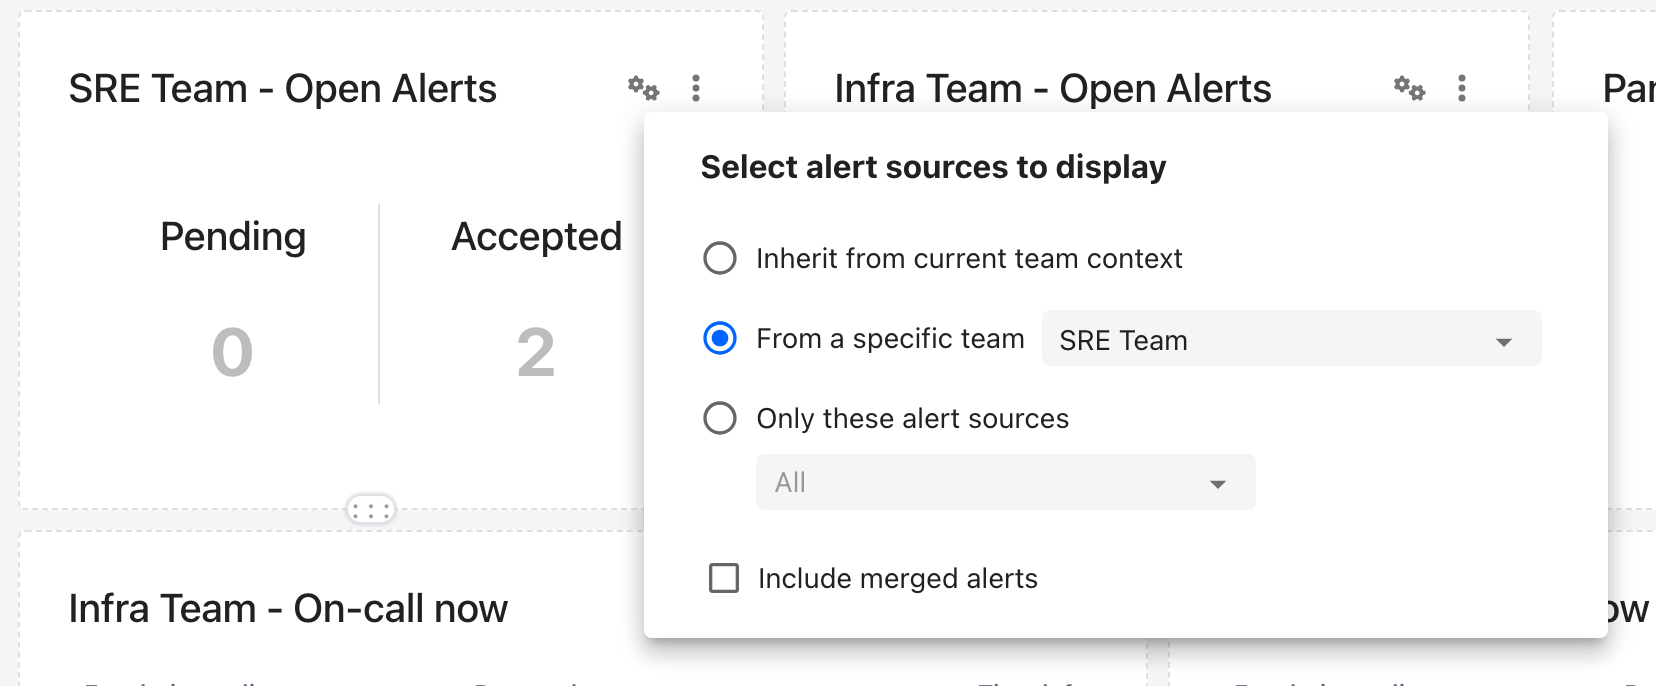
Every widget's settings start with the same choice, under a heading that names what the widget lists, such as **Select alert sources to display**:
| Choice | The widget covers |
| -------------------------------------------------------------------------------------------------------- | -------------------------------------------------------------------------------------------- |
| **Inherit from current team context** | The team selected in the top bar, so it follows you when you switch teams |
| **From a specific team** | The [team](/users-and-access-management/teams.md) you pick, whichever team the top bar shows |
| **Only these alert sources**, **Only these policies**, **Only these services** or **Only these metrics** | Exactly the items you select |
Each widget's gear icon opens its settings. Changes are kept only when you save the dashboard.
A changed setting shows in the widget as soon as you close its settings, and is kept only when you save the dashboard.
## Edit a dashboard
Click **Edit**. In edit mode you can:
* **move** a widget by dragging it, and **resize** it by dragging its right or bottom edge. Widgets move up to fill any gap;
* **rename** a widget by clicking its title;
* **duplicate** or **delete** a widget from its three-dot menu;
* **add** a widget with **Add**, or with the empty tile after the last widget. **Add** is unavailable once the dashboard has 40 widgets.
**Save** keeps every change, including a new name or visibility. **Cancel** discards all of them. While you edit, the list of dashboards is unavailable.
## Who can see and change a dashboard
| Visibility | Who sees it | Who can change it |
| ----------------------------- | ------------------------ | ------------------------------------------- |
| **Private** | Only you | Only you |
| **Public**, **View only** | Everyone in your account | Only its owner |
| **Public**, **View and edit** | Everyone in your account | Anyone whose role lets them edit dashboards |
A public dashboard names its **Owner** under the dashboard's name, next to its visibility. To change the visibility, click **Edit**, click the current value next to **Visibility**, choose under **Who can access this dashboard?**, and click **Save**.
Users with the [Stakeholder role](/users-and-access-management/user-roles-and-permissions.md) do not see the dashboard.
## Duplicate, delete or share a dashboard
The three-dot menu next to **Edit** offers:
* **Duplicate**, which creates a copy of the dashboard straight away;
* **Delete**, after you confirm. You cannot delete your only dashboard;
* **Share import URL**, on private dashboards only. It gives you a link: a colleague who opens it sees a copy of your dashboard, which becomes a dashboard of their own when they click **Save**. Yours stays private and unchanged.
## Make it your home page
To land on your dashboard every time you sign in, open the user menu at the right end of the top bar, choose **About me**, tick **Use dashboard as home page**, and click **Save**.
## FAQ
### Why can't I edit a dashboard?
It is public with **View only**, and you are not its owner. Ask the owner to change it to **View and edit**.
### Why does Open alerts show a different count from the alert list?
The widget counts only what its settings cover. With **Inherit from current team context**, that is the team selected in the top bar. It also leaves out merged alerts unless **Include merged alerts** is ticked. See [Merging alerts](/alerting/working-with-alerts/merging-alerts.md).
### Why can't I open the list of dashboards?
It is unavailable while you edit a dashboard. Click **Save** or **Cancel** first.
---
# Agent Instructions
This documentation is published with GitBook. GitBook is the documentation platform designed so that both humans and AI agents can read, navigate, and reason over technical content effectively. Learn more at gitbook.com.
## Querying This Documentation
If you need additional information that is not directly available in this page, you can query the documentation by asking a question.
Perform an HTTP GET request on the following URL with the `ask` and `goal` query parameters:
```
GET https://docs.ilert.com/alerting/working-with-alerts/dashboard.md?ask=&goal=
```
`ask` is the immediate question: it should be specific, self-contained, and written in natural language.
`goal` is what the user is ultimately trying to achieve, the reason they need the answer. Sharing it helps GitBook give you a better, more relevant answer. A goal is most helpful when it describes the outcome the user wants rather than restating the question. For example, with `ask=how do I create an API token`, a goal like `automate deployments from our CI pipeline` lets GitBook tailor the answer to that use case.
The response will contain a direct answer to the question and relevant excerpts and sources from the documentation.
Use this mechanism when the answer is not explicitly present in the current page, you need clarification or additional context, or you want to retrieve related documentation sections.