> For the complete documentation index, see [llms.txt](https://docs.ilert.com/llms.txt). Markdown versions of documentation pages are available by appending `.md` to page URLs; this page is available as [Markdown](https://docs.ilert.com/incidents-and-status-pages/metrics.md).
# Metrics
Numbers on a status page. A metric turns "is it up?" into "here is how it is actually performing", for anybody who can read the page.
A status lozenge answers one question: is this broken. A metric answers the next one — how well is it working, and is it getting better. Response time, error rate, queue depth, open tickets: anything you can express as a number over time.
Metrics appear on [status pages](/incidents-and-status-pages/status-pages.md), alongside the [services](/incidents-and-status-pages/services.md) they describe. ilert stores each one as pairs of a floating-point value and a timestamp, and you either post those values yourself or have ilert fetch them from a monitoring tool you already run.
Metrics live on the **Metrics** tab of **Status pages**, in the sidebar under **Incident comms**.
## The two ways a metric can look
### Line graph
* **Display name** — what readers see, and the label on the status page.
* **Period** — the reader chooses 24 hours (**Day**), 7 days (**Week**) or 28 days (**Month**).
* **Aggregated value** — one number summarising the visible period, shown at the top right. It can be hidden.
* **Display unit** — a suffix, purely cosmetic. `ms`, `%`, `errors`, `req/min`, or nothing at all.
### Single number
The same aggregation, without the graph. Reach for it when the shape over time is noise and only the current figure means anything.
### Aggregations
Both display types use the same five functions, applied over whichever period the reader has selected:
| Aggregation | Summarises as |
| ----------- | --------------------------------------- |
| **AVG** | The average of all values in the period |
| **SUM** | Their sum |
| **MIN** | The smallest |
| **MAX** | The largest |
| **LAST** | The most recent value, by timestamp |
{% hint style="info" %}
**Graphs are aggregated twice, and that is deliberate.**
A metric can hold a point every 30 seconds, which is far more points than a graph has pixels. So ilert first rolls the raw points up into intervals, using the same function you picked above:
| Period | Interval |
| ------ | ---------- |
| Day | 5 minutes |
| Week | 30 minutes |
| Month | 2 hours |
Then it applies that function again across the whole period to produce the aggregated value in the corner.
{% endhint %}
#### Linear interpolation
Data has gaps — an exporter restarts, a job misses a run. **Interpolate gaps in data** draws a straight line between the two known points either side of the gap. Turn it off and gaps stay gaps.
| Interpolation enabled | Interpolation disabled |
| :-----------------------------------------------------------------------------------------------------------------------------------------------------------------------------------------------------------------: | :-----------------------------------------------------------------------------------------------------------------------------------------------------------------------------------------------------------------: |
|  |  |
Which is the honest choice depends on the metric. A gap in a latency graph means *we did not measure*, and a line drawn across it tells readers it was fine — which you may not know.
## Create a metric
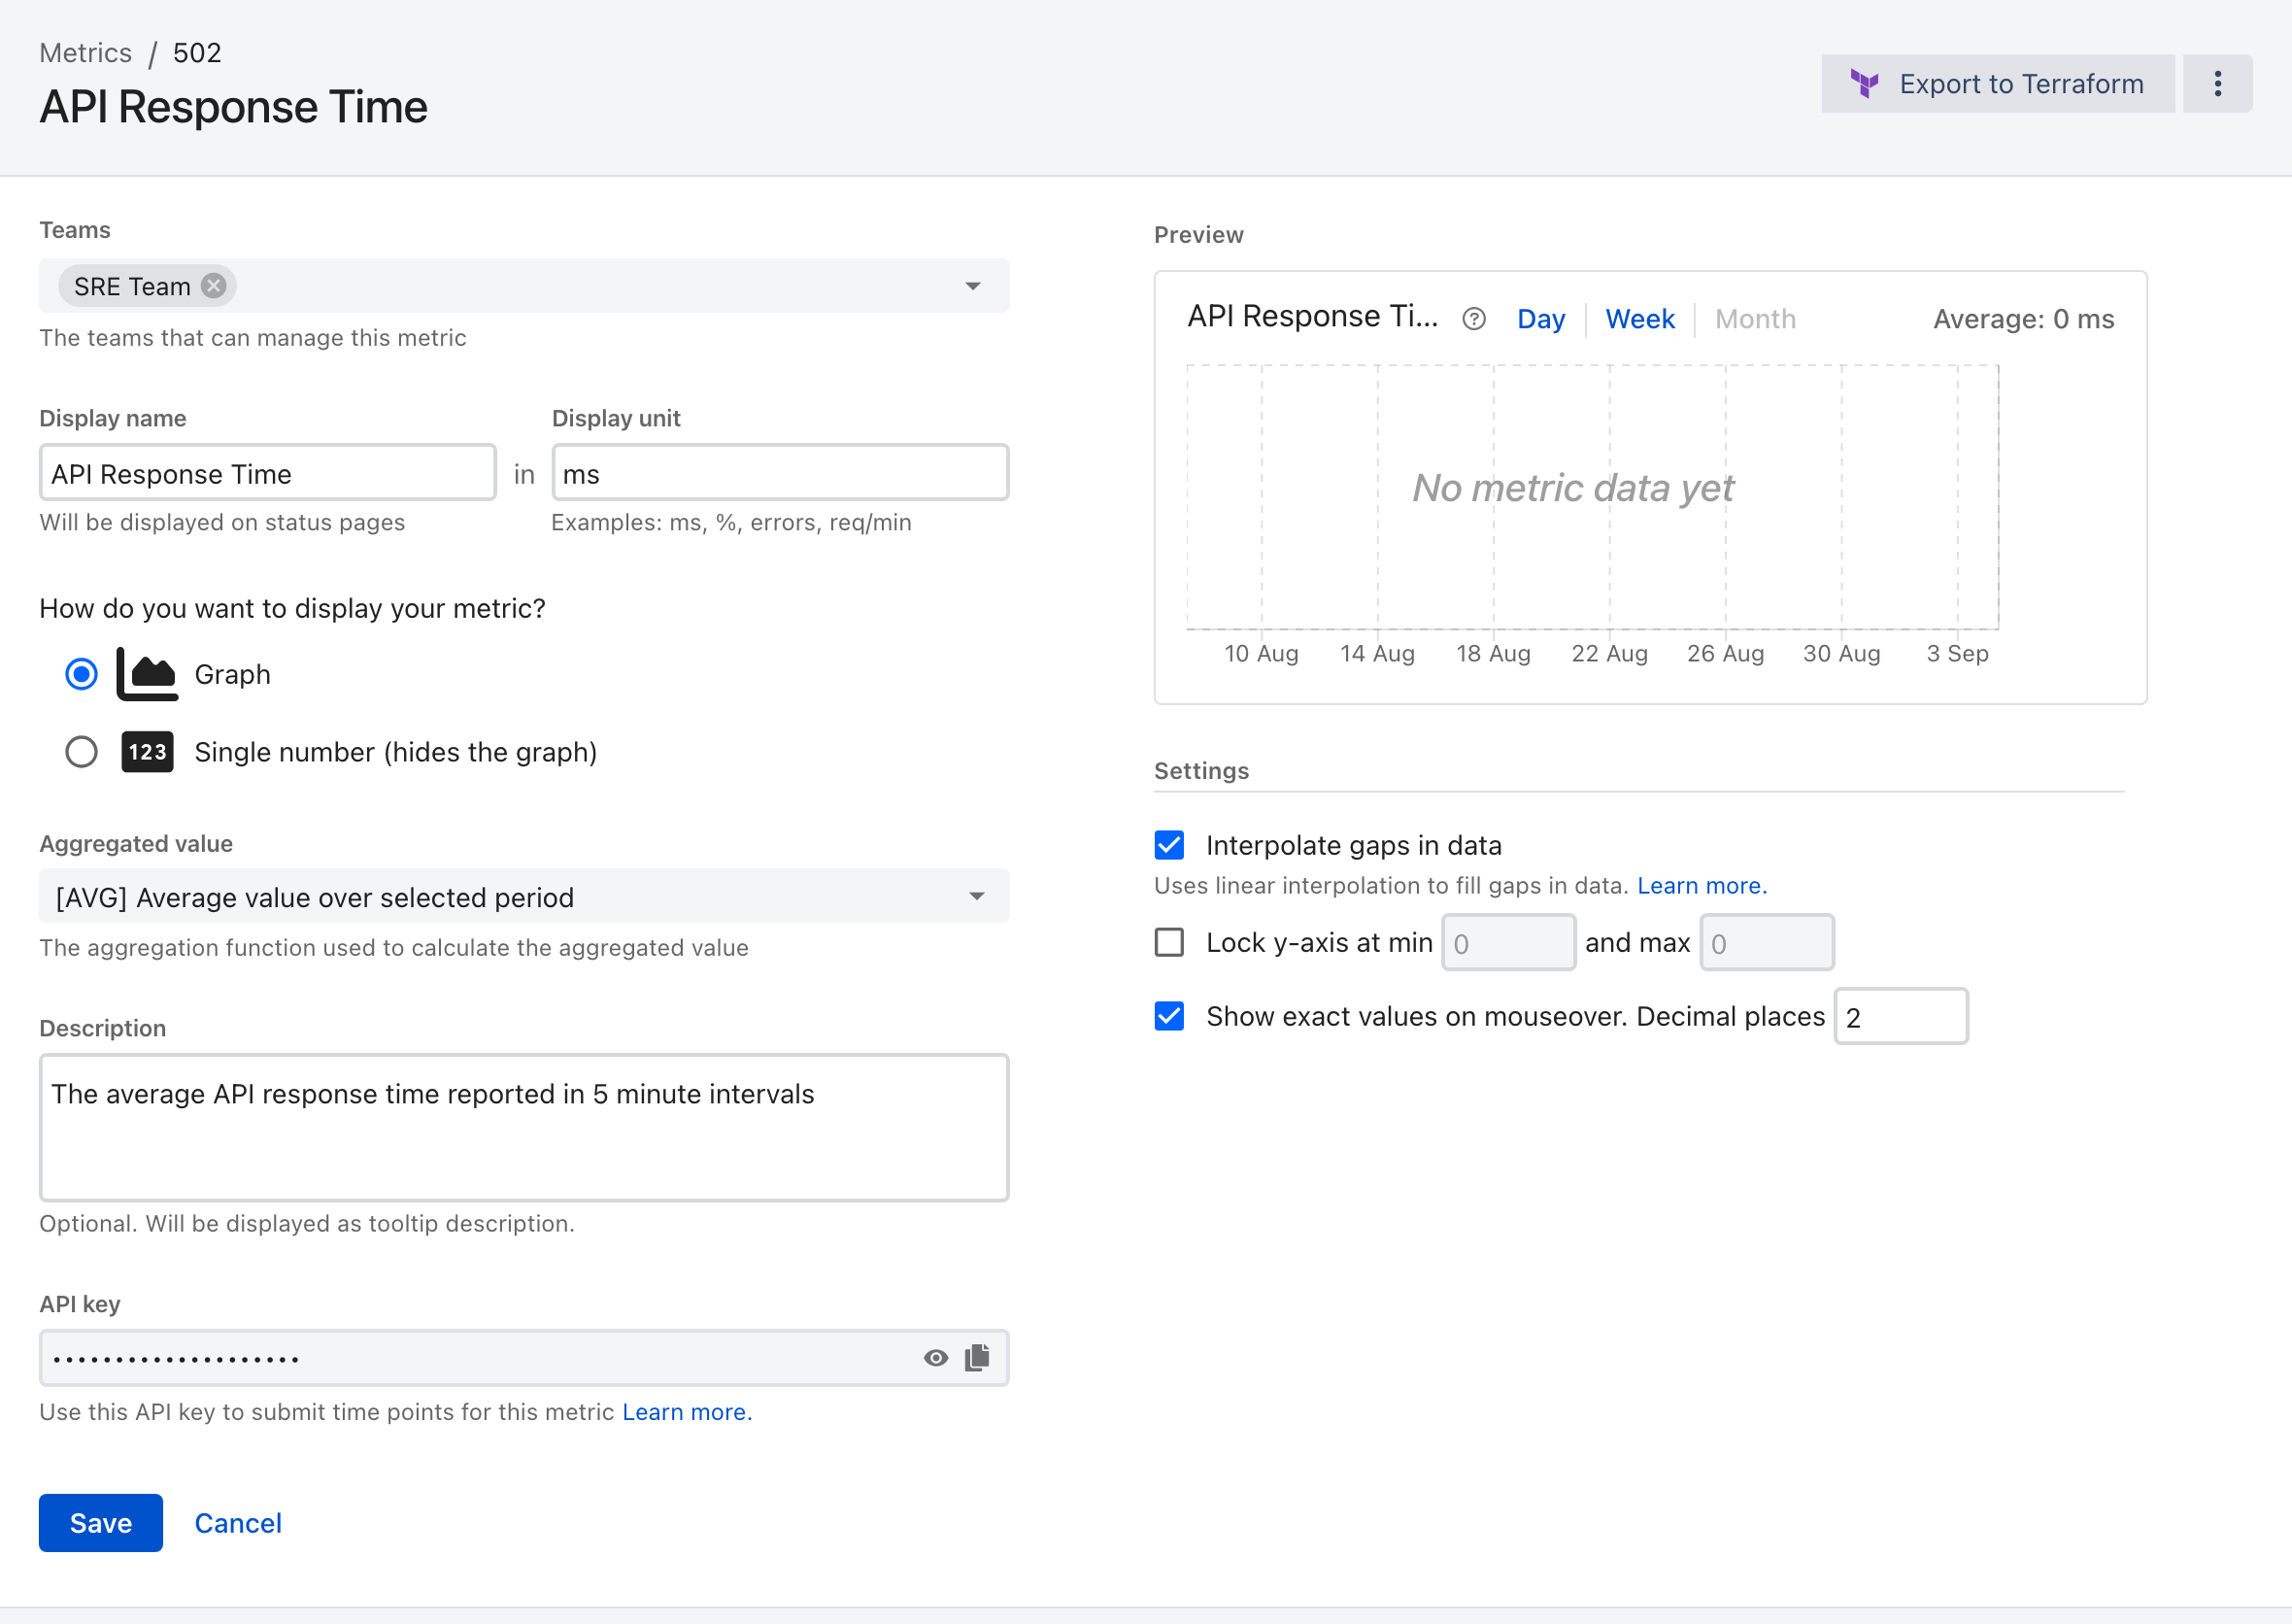
1. Go to **Status pages** in the sidebar, open the **Metrics** tab, and click **Create metric**.
2. Choose where the data comes from:
* **I'll post my own data** — you send values to ilert. See [Submit data points to a metric](#submit-data-points-to-a-metric).
* [**Datadog**](/incidents-and-status-pages/metrics/import-metrics-from-datadog.md) or [**Prometheus**](/incidents-and-status-pages/metrics/import-metrics-from-prometheus.md) — ilert pulls the data by running a query you supply.
3. Configure the metric and save.
The preview on the right redraws as you change the settings on the left.
| Field | What it does |
| -------------------- | ------------------------------------------------------------------ |
| **Teams** | Who can manage the metric |
| **Display name** | Shown on status pages |
| **Display unit** | The suffix after the number |
| **Display type** | **Graph**, or **Single number (hides the graph)** |
| **Aggregated value** | One of the [five aggregations](#aggregations) |
| **Description** | Optional. Becomes a tooltip beside the name |
| **API key** | The metric's own key, for posting data. Masked until you reveal it |
The **Settings** group, under the preview, applies to graph metrics:
* **Interpolate gaps in data** — see [Linear interpolation](#linear-interpolation).
* **Lock y-axis at min … and max …** — pin the scale so the shape keeps its meaning between visits. Worth doing for a percentage.
* **Show exact values on mouseover** — and how many **decimal places**.
{% hint style="info" %}
A metric imported from Datadog or Prometheus keeps the query it was created with. **The query cannot be changed afterwards** — to change it, create a new metric.
{% endhint %}
## Add a metric to a status page
1. Open the [status page](/incidents-and-status-pages/status-pages.md).
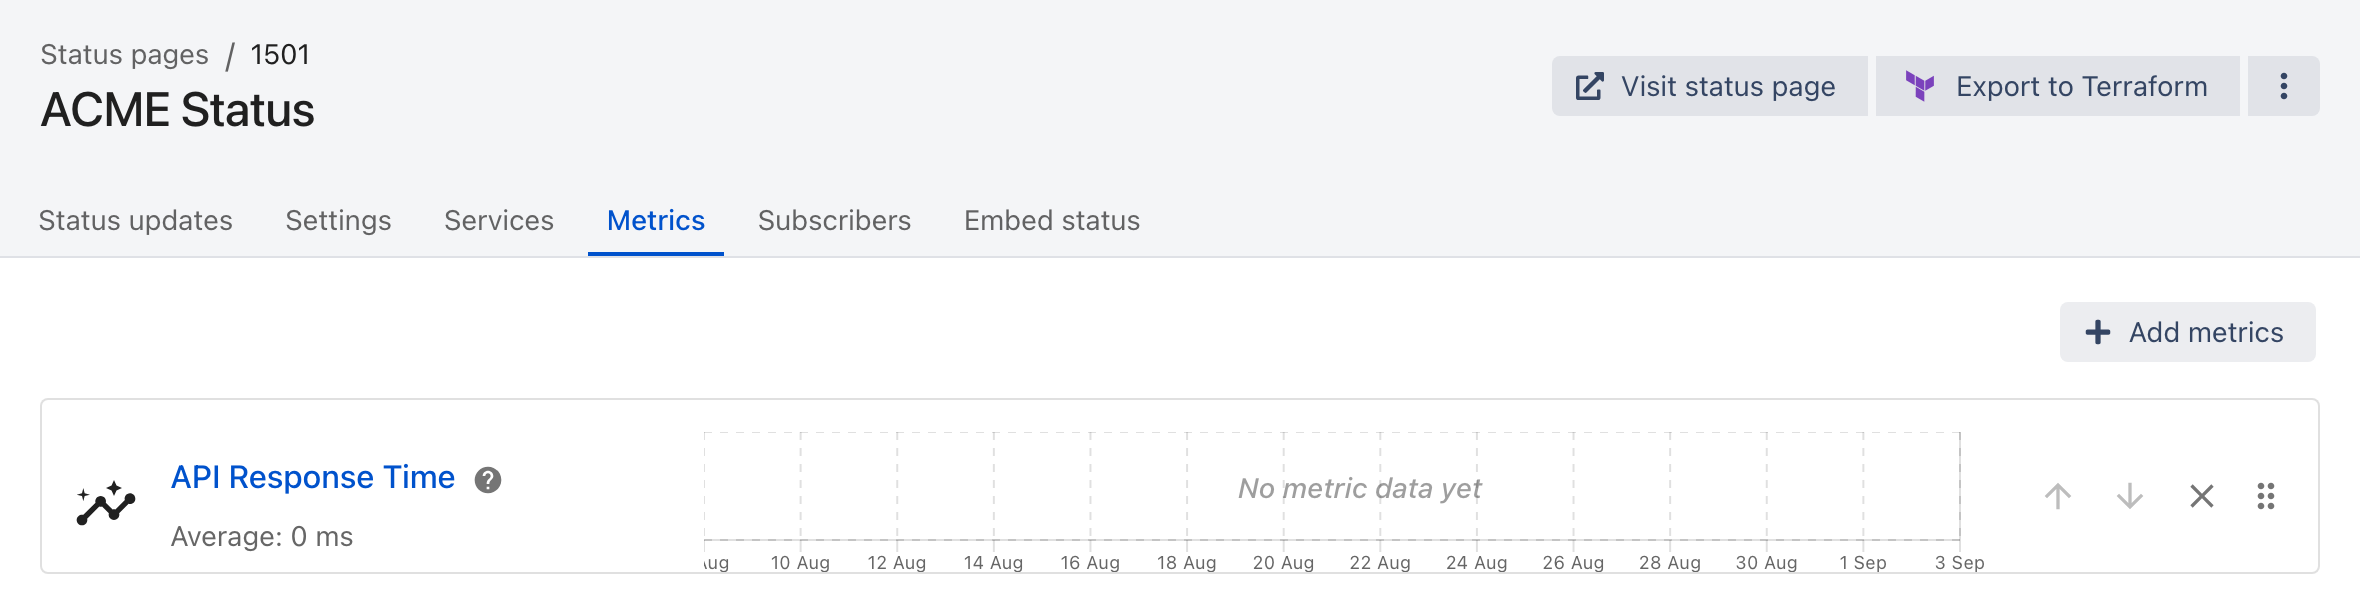
2. Go to its **Metrics** tab and click **Add metrics**.
3. Reorder with drag and drop. The order here is the order readers see.
Each row previews the metric as readers will see it.
One metric can appear on as many status pages as you like.
## Submit data points to a metric
A data point is one HTTP POST, authenticated by the metric's own API key. No user credentials, and no headers beyond the content type:
```shell
curl -X POST 'https://api.ilert.com/api/series/YOUR_METRIC_API_KEY' \
-H 'Content-Type: application/json' \
-d '{ "value": 8.223 }'
```
Omit the timestamp and ilert uses the time the point arrives. To backfill, or to send a batch, give each point a `timestamp` as a **Unix epoch in seconds**:
```shell
curl -X POST 'https://api.ilert.com/api/series/YOUR_METRIC_API_KEY' \
-H 'Content-Type: application/json' \
-d '{ "series": [
{ "timestamp": 1767225600, "value": 8.223 },
{ "timestamp": 1767225630, "value": 7.940 }
] }'
```
Both forms return **202 Accepted**. See the [Series API reference](/developer-docs/rest-api/api-reference/series.md).
{% hint style="info" %}
**Every metric has its own API key**, on the metric's settings page. Your personal API key does not work here.
{% endhint %}
{% hint style="info" %}
**What ilert stores**
* At most one data point per 30 seconds. Each point is truncated to the nearest 30-second interval, and a higher-resolution stream keeps only the last point in each.
* Data up to 28 days in the past. When you create a metric, backfilling those 28 days gives readers something to look at on day one.
{% endhint %}
### Generate sample data
To see how a metric will look before you have wired anything up, open it, click the **⋮** menu and choose **Generate demo data**. Give it a **Data low** and a **Data high** and confirm; ilert fills the metric with one batch of random values in that range.
### Clear a metric's data
Same menu, **Delete metric data**. It removes every data point and keeps the metric.
---
# Agent Instructions
This documentation is published with GitBook. GitBook is the documentation platform designed so that both humans and AI agents can read, navigate, and reason over technical content effectively. Learn more at gitbook.com.
## Querying This Documentation
If you need additional information that is not directly available in this page, you can query the documentation by asking a question.
Perform an HTTP GET request on the following URL with the `ask` and `goal` query parameters:
```
GET https://docs.ilert.com/incidents-and-status-pages/metrics.md?ask=&goal=
```
`ask` is the immediate question: it should be specific, self-contained, and written in natural language.
`goal` is what the user is ultimately trying to achieve, the reason they need the answer. Sharing it helps GitBook give you a better, more relevant answer. A goal is most helpful when it describes the outcome the user wants rather than restating the question. For example, with `ask=how do I create an API token`, a goal like `automate deployments from our CI pipeline` lets GitBook tailor the answer to that use case.
The response will contain a direct answer to the question and relevant excerpts and sources from the documentation.
Use this mechanism when the answer is not explicitly present in the current page, you need clarification or additional context, or you want to retrieve related documentation sections.