> For the complete documentation index, see [llms.txt](https://docs.ilert.com/llms.txt). Markdown versions of documentation pages are available by appending `.md` to page URLs; this page is available as [Markdown](https://docs.ilert.com/incidents-and-status-pages/service-topology/telemetry-sources.md).

# Telemetry sources

A telemetry source is an OpenTelemetry (OTLP) ingestion endpoint that your services push traces to. ilert samples those traces, extracts the service-to-service dependencies, and continuously builds your [service topology](/incidents-and-status-pages/service-topology.md) — no manual wiring required.

{% hint style="info" %}
**Beta**

Telemetry sources and [service topology](/incidents-and-status-pages/service-topology.md) are currently in beta. Details of the UI and behavior may change.
{% endhint %}

## How it works

ilert uses a **push model** — you never share credentials with ilert. Your services (or an OpenTelemetry Collector) send OTLP traces to the endpoint, authenticated with an ingestion token:

1. Your services export **OTLP traces** to the telemetry source endpoint.
2. ilert inspects outbound **client** and **producer** spans to derive edges — the caller's `service.name` becomes the source, and the target is taken from span attributes such as `peer.service`, `server.address`, or `db.system`.
3. The discovered edges are merged into a single per-account **topology graph**, and any previously unseen service is created in your [service catalog](/incidents-and-status-pages/services.md).
4. The [Service Health map](/incidents-and-status-pages/service-topology.md#the-service-health-map) updates live as traces continue to arrive.

Multiple telemetry sources all merge into the same topology graph, so you can, for example, use one source per team or per environment.

## Create a telemetry source

The create wizard has two steps: **Configure** and **Connect & verify**.

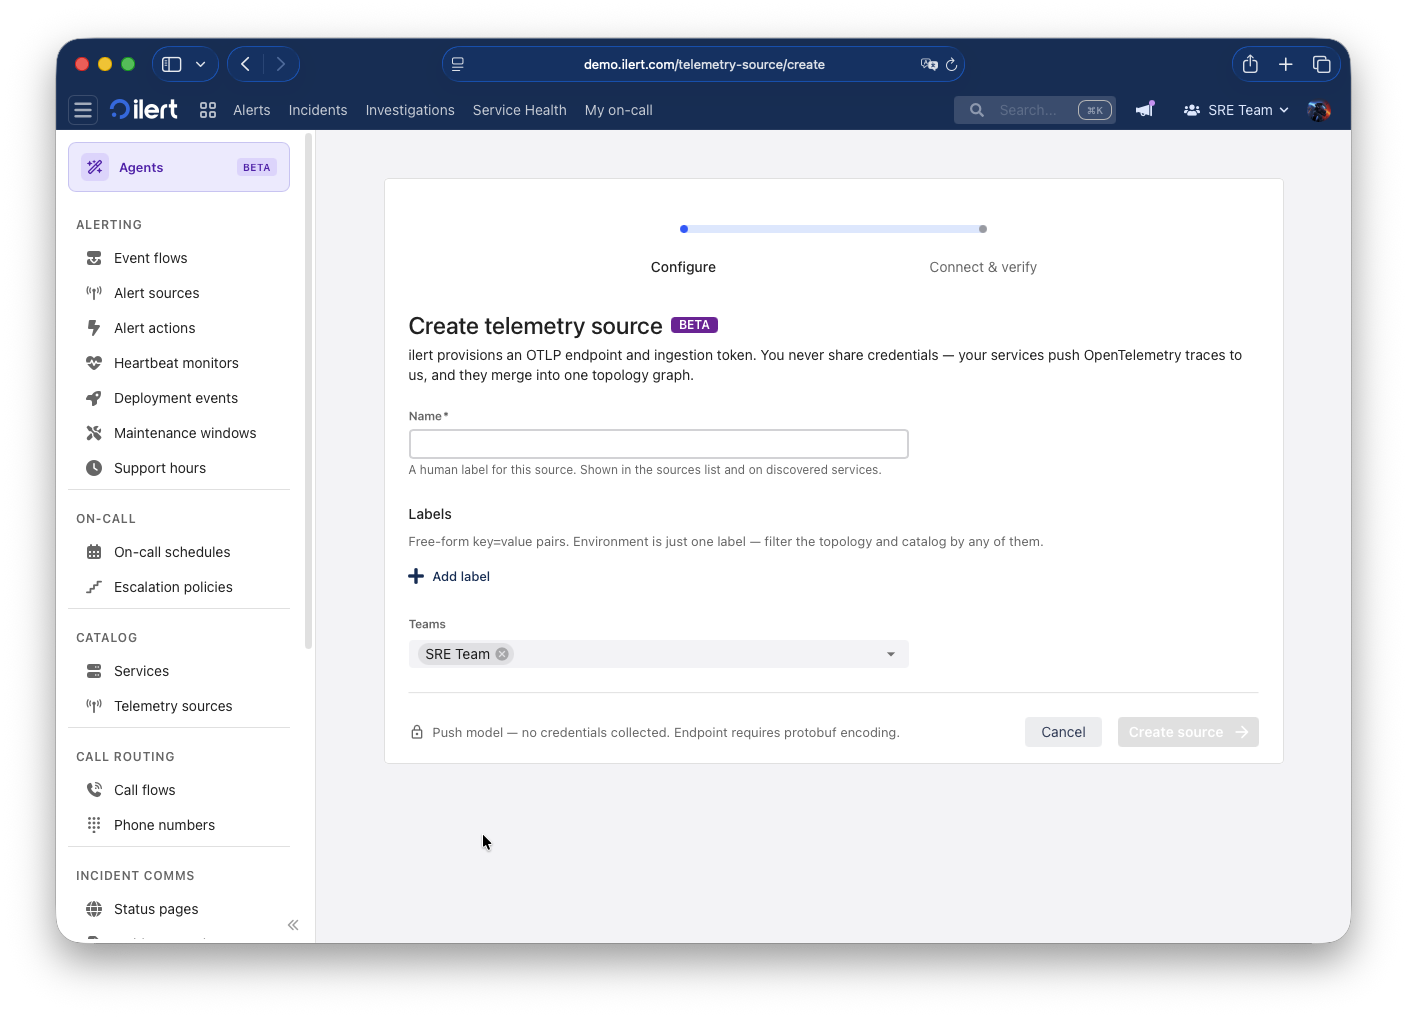
1. Open **Telemetry sources** under **Catalog** in the sidebar and click **Create telemetry source**.
2. Give the source a **name**. This is a human label shown in the sources list.
3. Optionally add **labels** (free-form `key: value` pairs) and assign the source to one or more **teams**.
4. Click **Create source**.

<figure><img src="/files/fg2mL82aNoPfcFUozLLB" alt="Creating a telemetry source"><figcaption><p>Step 1 of the wizard — name, labels and teams</p></figcaption></figure>

{% hint style="info" %}
Telemetry sources use a push model, so ilert collects no credentials from you. The ingest endpoint accepts OTLP over HTTP or gRPC, encoded as either **protobuf** (the exporter default) or **JSON**.
{% endhint %}

## Connect your services

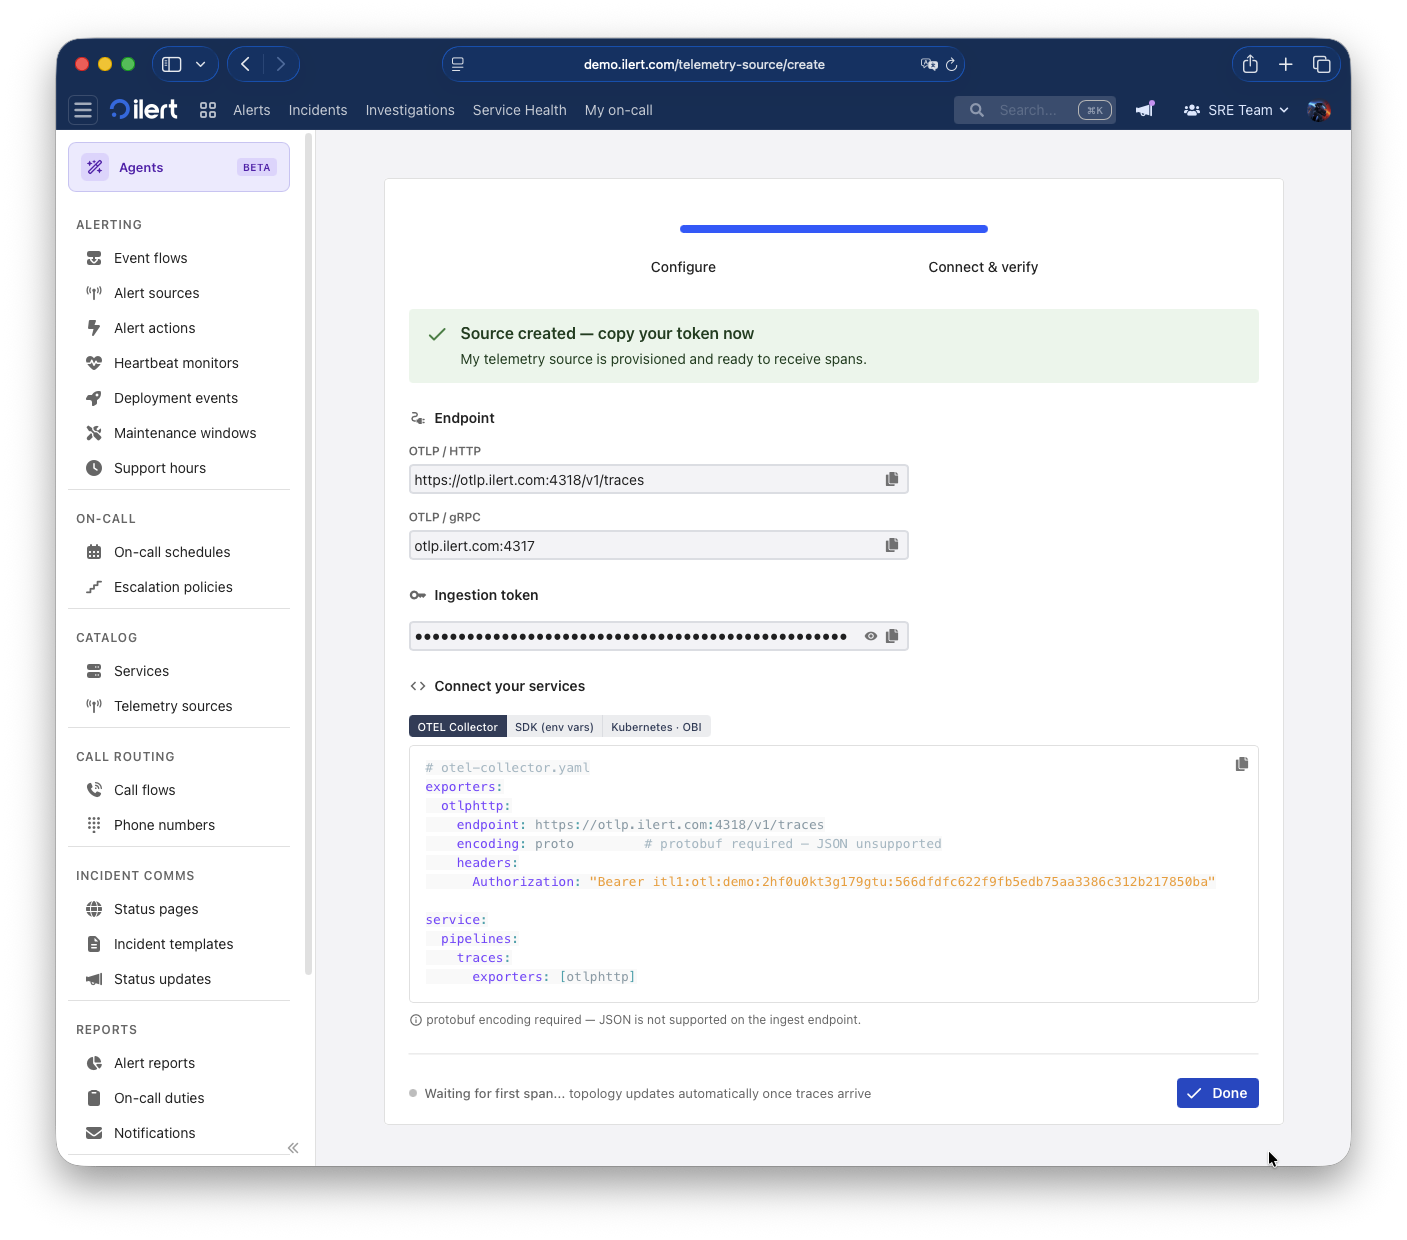
In the **Connect & verify** step ilert provisions the endpoint and an ingestion token. Copy the token now — you configure your OpenTelemetry exporter to send traces to the endpoint with the token as a bearer credential.

<figure><img src="/files/Z4RXbd9AhrJdMVLkOzAQ" alt="Connecting your services to a telemetry source"><figcaption><p>Step 2 of the wizard — endpoints, ingestion token and ready-to-copy exporter configuration</p></figcaption></figure>

### Endpoints

| Protocol    | Base endpoint                 |
| ----------- | ----------------------------- |
| OTLP / HTTP | `https://otlp.ilert.com:4318` |
| OTLP / gRPC | `otlp.ilert.com:4317`         |

These are **base** endpoints — configure them as your exporter's OTLP endpoint and the exporter appends the signal path (`/v1/traces`) automatically. If you are posting to the HTTP endpoint directly (not through an OTLP exporter), the full traces URL is `https://otlp.ilert.com:4318/v1/traces`.

Authenticate every request with the ingestion token:

```
Authorization: Bearer <ingestion-token>
```

The wizard provides ready-to-copy configuration for common setups:

{% tabs %}
{% tab title="OTEL Collector" %}

```yaml
# otel-collector.yaml
exporters:
  otlphttp:
    endpoint: https://otlp.ilert.com:4318   # base endpoint — /v1/traces is appended automatically
    encoding: proto                          # proto (default) or json — both accepted
    headers:
      Authorization: "Bearer <ingestion-token>"

service:
  pipelines:
    traces:
      exporters: [otlphttp]
```

{% endtab %}

{% tab title="SDK (env vars)" %}

```bash
export OTEL_EXPORTER_OTLP_ENDPOINT="https://otlp.ilert.com:4318"
export OTEL_EXPORTER_OTLP_HEADERS="Authorization=Bearer <ingestion-token>"
```

{% endtab %}

{% tab title="Kubernetes · OBI" %}

```yaml
# OBI DaemonSet env
env:
  - name: OTEL_EXPORTER_OTLP_ENDPOINT
    value: "https://otlp.ilert.com:4318"
  - name: OTEL_EXPORTER_OTLP_HEADERS
    value: "Authorization=Bearer <ingestion-token>"
```

{% endtab %}
{% endtabs %}

{% hint style="info" %}
The ingest endpoint accepts both **protobuf** and **JSON** OTLP payloads. Most exporters default to protobuf, which is recommended; JSON works too if your exporter is configured for it.
{% endhint %}

Once traces start flowing, the topology updates automatically — there is nothing else to configure.

## Endpoint and ingestion token

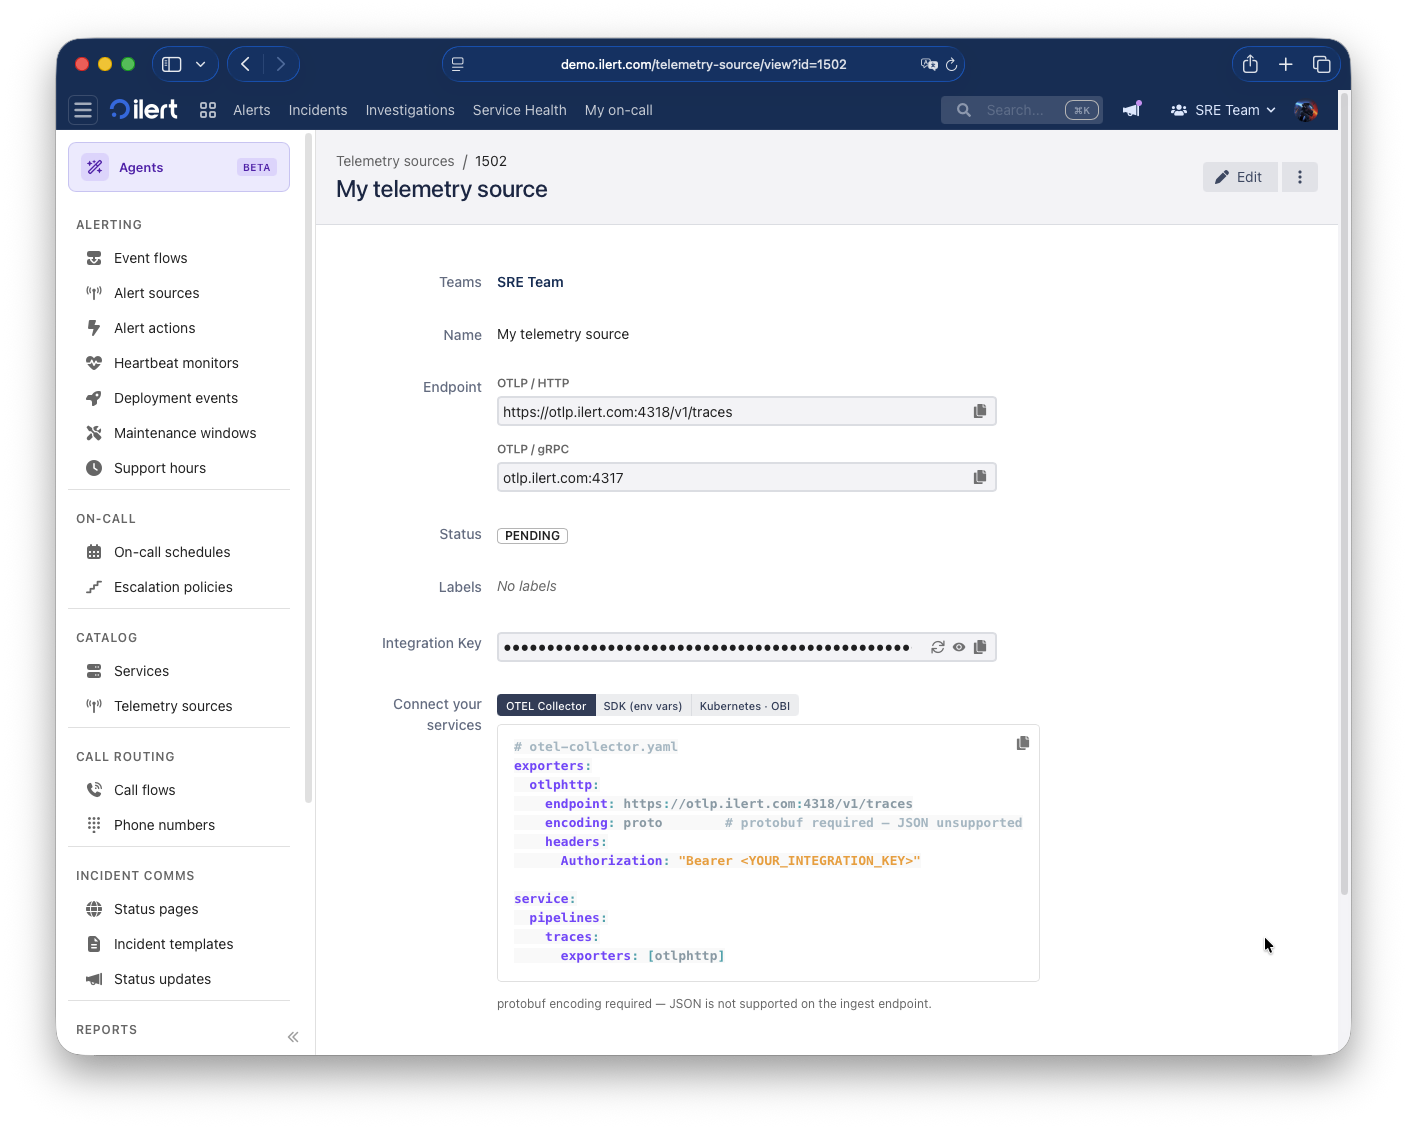
You can view the endpoints and the token — shown as **Integration Key** — again at any time from the telemetry source's detail page. The key is masked by default and visible only to users with write permission.

<figure><img src="/files/oVwZWfHGy5KDwwBk37Ok" alt="A telemetry source detail page"><figcaption><p>The telemetry source detail page, with endpoints, status and the masked integration key</p></figcaption></figure>

If a key is ever exposed, rotate it: open the source and choose **Rotate integration key** to issue a new key, then roll it out to your exporters. Treat the exposed key as compromised and rotate as soon as possible.

## Ingestion status

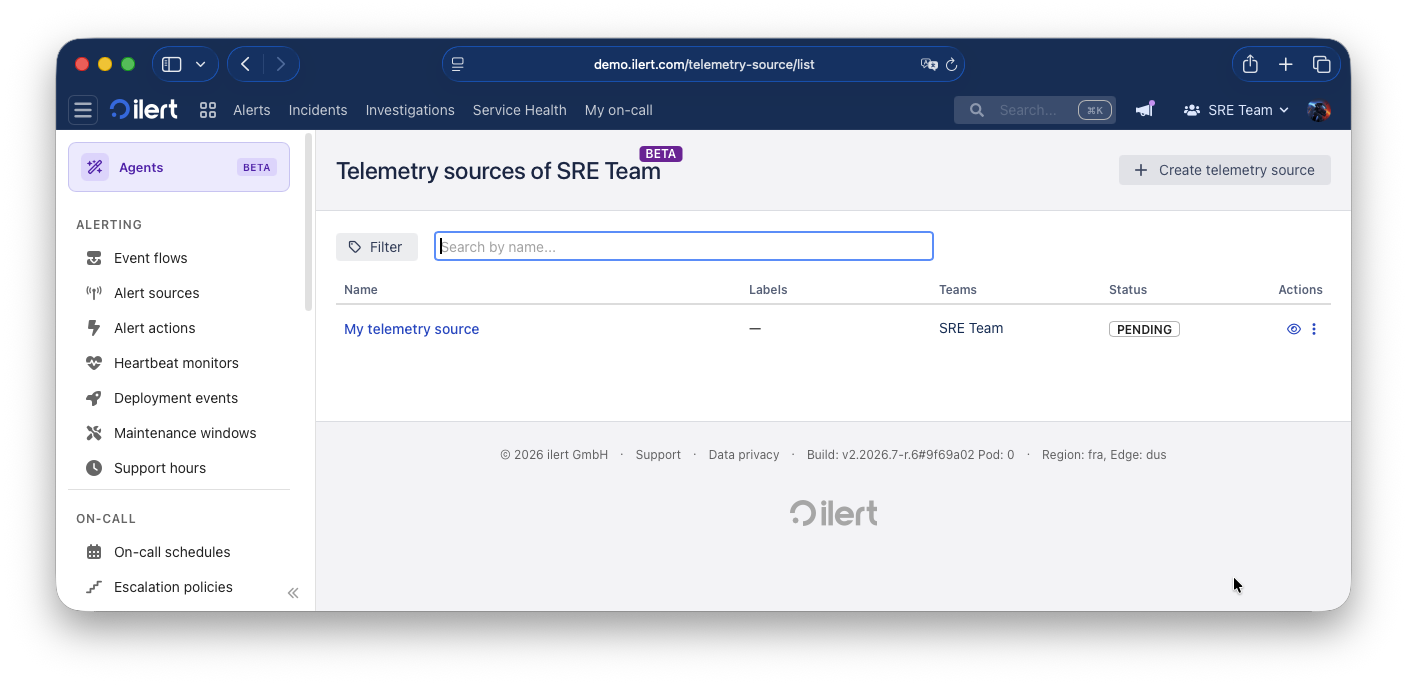
The sources list shows each source with its labels, teams and ingestion status, so you can confirm data is arriving:

| Status    | Meaning                                                       |
| --------- | ------------------------------------------------------------- |
| Receiving | Traces are being received.                                    |
| Stopped   | The source was receiving traces but none have arrived lately. |
| Error     | Ingestion is failing.                                         |
| Pending   | The source is provisioned but no traces have been seen yet.   |

<figure><img src="/files/6xPKZfw75FCBd1iJZZoe" alt="The Telemetry sources list"><figcaption><p>The Telemetry sources list, scoped to the currently selected team</p></figcaption></figure>

## Labels on discovered services

When ilert creates a service for the first time from your traces, it enriches it with labels derived from the OpenTelemetry **resource attributes** your services report. This makes it easy to filter the topology and service catalog by environment, namespace, cloud, and more.

Labels are applied **only when a service is first created** — an existing service's labels are never overwritten, so manual edits are safe. A service that only appears as a dependency target (for example a database that doesn't emit its own spans) carries no labels until it starts reporting.

A selection of the mapping:

| ilert label                                         | OpenTelemetry resource attribute(s)                                             |
| --------------------------------------------------- | ------------------------------------------------------------------------------- |
| `env`                                               | `deployment.environment.name`, `deployment.environment`                         |
| `namespace`                                         | `service.namespace`                                                             |
| `version`                                           | `service.version`                                                               |
| `language`                                          | `telemetry.sdk.language`                                                        |
| `runtime`                                           | `process.runtime.name`                                                          |
| `k8s-namespace`, `k8s-cluster`, `k8s-deployment`, … | the matching `k8s.*.name`                                                       |
| `cloud`, `region`, `zone`, `cloud-account`          | `cloud.provider`, `cloud.region`, `cloud.availability_zone`, `cloud.account.id` |

High-cardinality attributes (such as pod name, host name, and instance id) are deliberately excluded.

## Next steps

* Explore your [service topology](/incidents-and-status-pages/service-topology.md) on the Service Health map.
* Review the auto-created services in your [service catalog](/incidents-and-status-pages/services.md).


---

# Agent Instructions
This documentation is published with GitBook. GitBook is the documentation platform designed so that both humans and AI agents can read, navigate, and reason over technical content effectively. Learn more at gitbook.com.

## Querying This Documentation
If you need additional information that is not directly available in this page, you can query the documentation dynamically by asking a question.

Perform an HTTP GET request on the current page URL with the `ask` query parameter, and the optional `goal` query parameter:

```
GET https://docs.ilert.com/incidents-and-status-pages/service-topology/telemetry-sources.md?ask=<question>&goal=<endgoal>
```

`ask` is the immediate question: it should be specific, self-contained, and written in natural language.
`goal` is optional and describes the broader end goal you are ultimately trying to accomplish on behalf of the user. GitBook uses it to tailor the answer towards what is most useful for that goal.

The response will contain a direct answer to the question and relevant excerpts and sources from the documentation.

Use this mechanism when the answer is not explicitly present in the current page, you need clarification or additional context, or you want to retrieve related documentation sections.