> For the complete documentation index, see [llms.txt](https://docs.ilert.com/llms.txt). Markdown versions of documentation pages are available by appending `.md` to page URLs; this page is available as [Markdown](https://docs.ilert.com/reports/overview.md).
# Overview
How the three ilert reports work, what each one answers, and the parameters, filters and exports they share.
Reports turn your alert history into numbers you can act on: how much you are being paged, how quickly you respond, who carries the on-call load, and which channels the notifications go out on. Each report draws a chart, backs it with a table, and exports to CSV.
There are three, and they sit on one page as tabs:
| Report | Answers | Available from |
| -------------------------------------------- | --------------------------------------------------------------------- | -------------- |
| [Alerts](/reports/alerts.md) | How many alerts, how fast were they accepted and resolved | Pro |
| [On-call duties](/reports/on-call-duties.md) | Who was on call, for how long, and how much of it was spent on alerts | Scale |
| [Notifications](/reports/notifications.md) | How many notifications went out, over which channel | Free |
Open them from the sidebar under **Reports** — **Alert reports**, **On-call duties** and **Notifications** — or switch between them with the tabs at the top of the page. Where a report is not in your plan, the entry carries a lock and the page offers an upgrade prompt instead of the chart. See [ilert pricing](https://www.ilert.com/pricing) for the full comparison.
{% hint style="info" %}
Reports describe [alerts](/alerting/overview.md), not [incidents](/incidents-and-status-pages/incidents.md). An alert is the actionable record that pages someone; MTTA and MTTR measure the response to it. Incident coordination is not reported on here.
{% endhint %}
## What every report shares
The right-hand panel is the same on all three: **Report Parameters** at the top, **Filters** below it, and **Apply** and **Clear filter** at the bottom. Edits to the panel are held until you click **Apply**.
{% hint style="warning" %}
**Metric** is not in that panel, and changing it runs the report immediately — along with any panel edits you had not applied yet. If you were halfway through changing a filter, that change goes live too. Finish with the panel before touching **Metric**.
{% endhint %}
### Date range
**Date range** sets the period the report covers. Open it and either pick two days in the calendar — click the first, then the second — or type into the **From** and **Until** fields. Four quick ranges sit under the calendar, labeled **Last:** **12 months**, **6 months**, **3 months** and **1 month**. They are relative to the day you click them, and they resolve to fixed dates straight away — so a bookmarked report keeps the range it had when you saved it rather than rolling forward.
| Today | Quick range | Resulting range |
| ----------- | ----------- | -------------------- |
| 8 Jun 2025 | 3 months | 8 Mar – 8 Jun 2025 |
| 1 Mar 2025 | 1 month | 1 Feb – 1 Mar 2025 |
| 31 Mar 2025 | 1 month | 28 Feb – 31 Mar 2025 |
The last row is not a rounding error: there is no 31 February, so the start date falls back to the last day of that month.
Both ends are inclusive. **From** is read as the start of that day and **Until** as the start of the following day, so everything on the first and last day is counted.
How far back you can usefully go is bounded by [data retention](/alerting/overview/data-retention.md): alerts and notifications are kept for 18 months, aggregated report data for 10 years.
### Time zone
Report data is rendered in the time zone on your **ilert user profile**, not the one your browser is in. When the two differ, the time zone name appears under the **Date range** field with an explanation. This matters at the edges of a range: an alert just before midnight lands in a different day — and possibly a different week — depending on which zone you read it in.
### Time granularity and week numbering
**Time granularity** — **Day**, **Week** or **Month** — decides what a single point on the chart stands for: a total or an average over that period. On the alert and notification reports the table follows it too, one row per period. The on-call report's tables do not — **Summary** always covers the whole range and **Shifts by day** is always daily.
**Week** is the only one that needs a decision, because countries do not agree on when a week starts or which week counts as the first of the year. ilert supports four combinations:
| First day of week | Week 1 is the first week that… | Short label |
| ----------------- | ----------------------------------------- | ----------- |
| Monday | has 4 or more days in the year (ISO 8601) | M,4 |
| Sunday | has 4 or more days in the year | S,4 |
| Sunday | contains January 1 | S,1 |
| Monday | contains January 1 | M,1 |
By default the numbering follows your **account's** locale. If the account has no locale but does have a region, that region is combined with your own language. Only when the account has neither does ilert fall back to the locale on your own user profile, and then to German. If the resolved country's numbering is not one of the four above, ISO 8601 is used instead.
A badge above the **Week** button tells you which rule is in force, and its color tells you where the rule came from:
| Badge shows | Color | Meaning |
| ---------------------------- | ------ | --------------------------------------------------------------------------- |
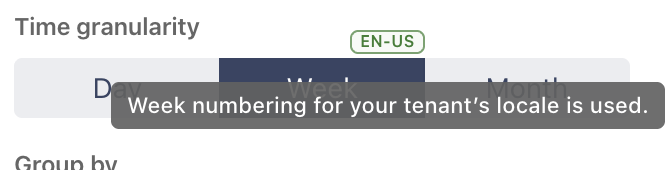
| A locale, such as `EN-US` | Green | The numbering came from your account |
| A locale | Red | It came from somewhere else — your own user profile, or the German fallback |
| `ISO` | Orange | That locale's numbering is not supported, so ISO 8601 was substituted |
| A short label, such as `M,4` | Blue | You chose the numbering yourself |
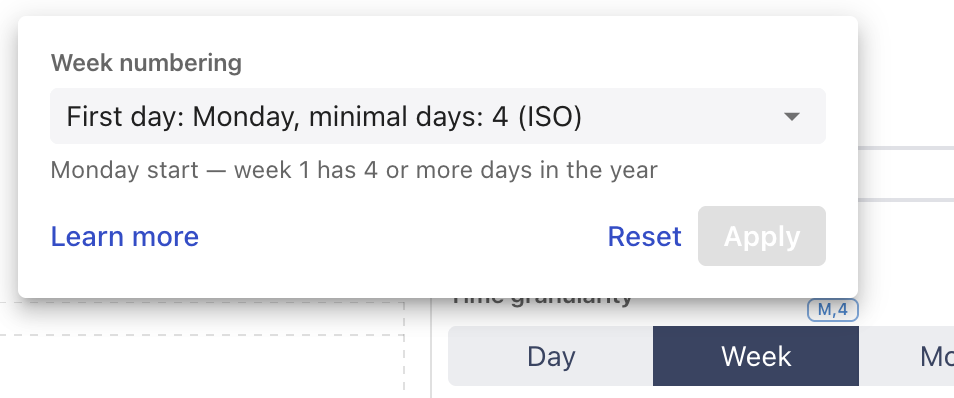
Click the badge to override it: pick an entry from **Week numbering**, then **Apply**. **Reset** returns to the default.
{% hint style="warning" %}
The override is stored in your browser, for your user and account. It applies to all three reports, but only where you set it — open the same report on another machine, in another browser, or after clearing site data, and you are back to the default.
{% endhint %}
A green badge naming a locale means the numbering came from your account.
Once you apply your own numbering, the badge switches to the short label — here M,4.
### Filters
The filters naming resources and people — **Teams**, **Alert Sources**, **Escalation policies**, **Responders**, **Schedules**, **Users** — are lists with an **Includes** / **Excludes** toggle beside them. **Includes** keeps only what you select; **Excludes** drops it. The alert report's **Alert priority**, **Severity**, **Merged alerts** and **Labels** are ordinary controls with no such toggle.
Two rules decide what you get when you combine the toggled ones:
* Filters in **Includes** are combined with *or*. An alert that matches any one of them is in the report.
* **Excludes** wins over **Includes**. Anything an exclude filter matches is dropped, even if an include filter matched it too.
The **Teams** filter, where your account has [teams](/users-and-access-management/teams.md), does double duty: it narrows the report and it narrows the other filters, so after selecting a team you only choose from that team's resources and people. You can select at most **10** teams; once you have ten, the rest of the list greys out.
### Sharing and exporting
Clicking **Apply** writes the parameters and filters into the page URL. Copy it from the address bar to bookmark a report or hand it to a colleague.
{% hint style="info" %}
Two things do not travel in that URL: the time zone and the week numbering. Both are read from whoever opens it — the time zone from their ilert profile, the week numbering from their own browser override. A colleague in another time zone can therefore open your link and see the same alerts fall into different days or weeks.
{% endhint %}
**Clear filter** empties the **Filters** section — teams, resources, responders, priority, severity, merged alerts and labels. It leaves **Report Parameters** alone, so the date range, granularity and grouping stay as they were, and the report does not change until you click **Apply**.
**Download** above each table saves the table as CSV, with the same filters applied.
---
# Agent Instructions
This documentation is published with GitBook. GitBook is the documentation platform designed so that both humans and AI agents can read, navigate, and reason over technical content effectively. Learn more at gitbook.com.
## Querying This Documentation
If you need additional information that is not directly available in this page, you can query the documentation by asking a question.
Perform an HTTP GET request on the following URL with the `ask` and `goal` query parameters:
```
GET https://docs.ilert.com/reports/overview.md?ask=&goal=
```
`ask` is the immediate question: it should be specific, self-contained, and written in natural language.
`goal` is what the user is ultimately trying to achieve, the reason they need the answer. Sharing it helps GitBook give you a better, more relevant answer. A goal is most helpful when it describes the outcome the user wants rather than restating the question. For example, with `ask=how do I create an API token`, a goal like `automate deployments from our CI pipeline` lets GitBook tailor the answer to that use case.
The response will contain a direct answer to the question and relevant excerpts and sources from the documentation.
Use this mechanism when the answer is not explicitly present in the current page, you need clarification or additional context, or you want to retrieve related documentation sections.