> For the complete documentation index, see [llms.txt](https://docs.ilert.com/llms.txt). Markdown versions of documentation pages are available by appending `.md` to page URLs; this page is available as [Markdown](https://docs.ilert.com/integrations/inbound-integrations/victoria-metrics.md).
# VictoriaMetrics Integration
Integrate VictoriaMetrics with ilert to forward Prometheus‑based alerts for metric threshold breaches to on‑call engineering teams.
[VictoriaMetrics](https://victoriametrics.com/) is a high-performance, scalable time series database that is designed for monitoring large-scale environments and efficiently storing and querying large volumes of metrics data. With the VictoriaMetrics integration, metric-triggered alerts – such as high latency or error rate breaches – from Prometheus-compatible systems are sent to on-call engineers via ilert. These alerts follow escalation policies for rapid triage and resolution of performance issues.
## In ilert: Create a VictoriaMetrics alert source
1. Go to **Alerting** → **Alert sources** and click **Create new alert source**.
2. Search for **VictoriaMetrics**, click its tile, and click **Next**.
3. Give your alert source a name, optionally assign teams, and click **Next**.
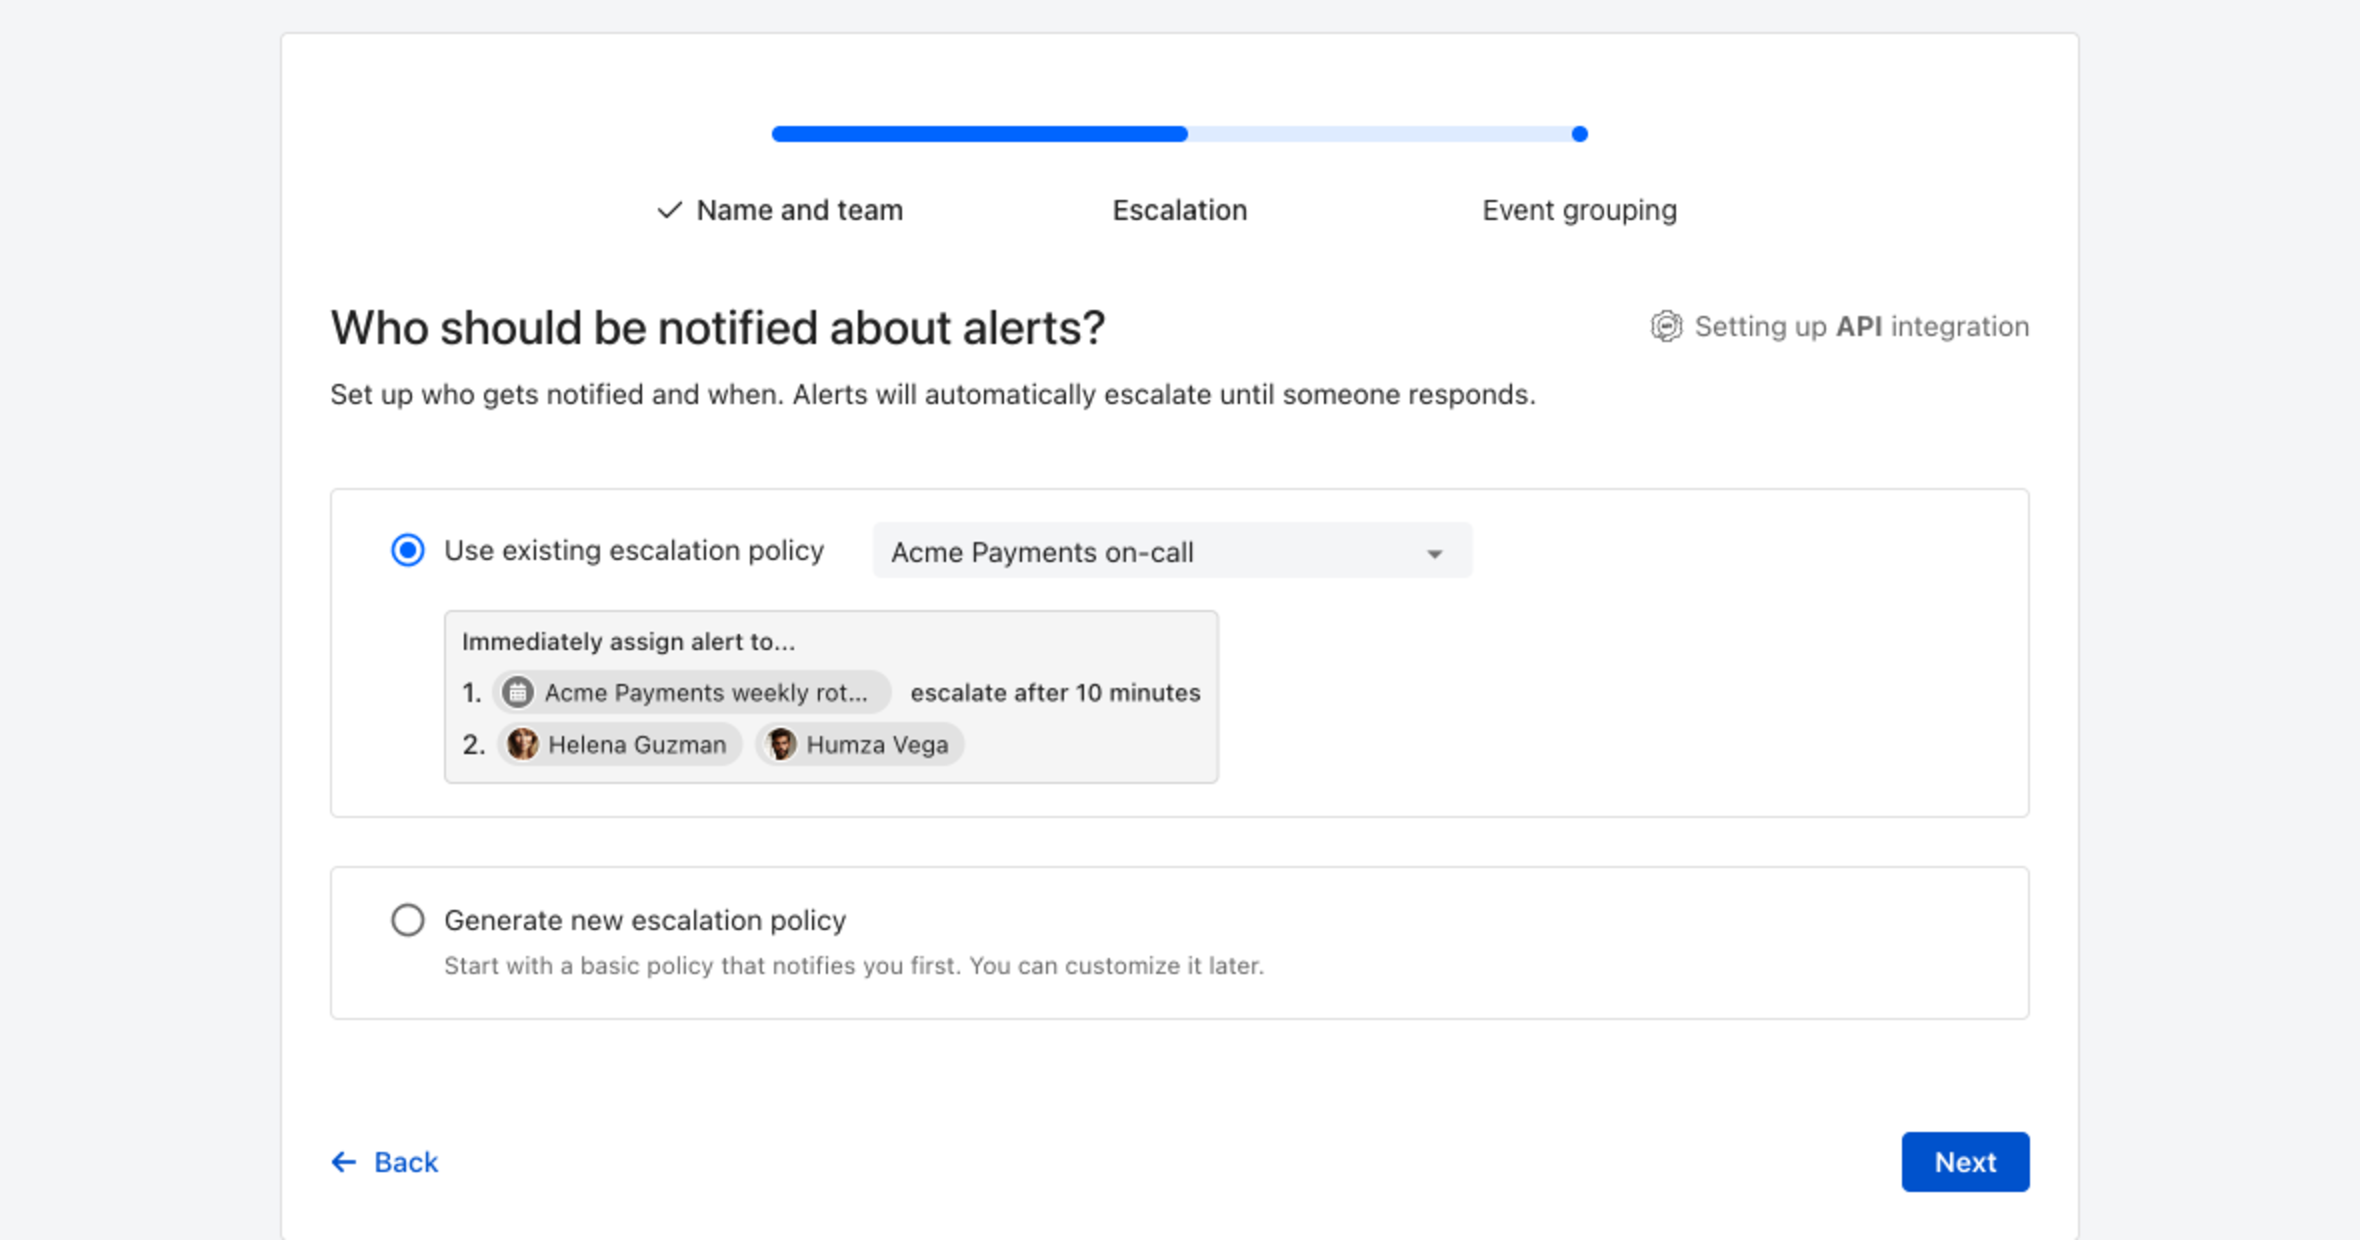
4. Choose who gets notified: select **Use existing escalation policy** and pick a policy, or **Generate new escalation policy** to start with a basic one that notifies you first. Click **Next**.
Pick an existing escalation policy, or generate a basic one without leaving the wizard.
5. Select **Default grouping** and click **Continue setup**. It groups events by the alert key the integration sets; the other [grouping options](/alerting/configure-alerting/alert-sources.md#event-grouping) are easier to judge once events are arriving.
6. The next page shows more settings, such as notification priority and alert templates. Click **Finish setup** for now; you can change them later.
7. On the final page, ilert shows the integration key and URL for this alert source. You will need them later in this guide.
## In Prometheus Alertmanager
> In order to be able to use VictoriaMetrics alerts and receive notifications, you need first configure and start alertmanager
1. Install Prometheus Alertmanager in any way that suits your needs. For more information about the alertmanager installation process please visit
2. Configure Alertmanager receivers in order to inform ilert every time there's an alert. In the example below replace the previously created VictoriaMetrics URL:
{% code title="alertmanager.yaml" lineNumbers="true" %}
```yaml
route:
receiver: ilert
receivers:
- name: "ilert"
webhook_configs:
- url: ""
send_resolved: true
```
{% endcode %}
{% hint style="info" %}
You could also split alert to high and low priority by creating two alert sources accordingly
{% endhint %}
## In VictoriaMetrics
1. Configure the `vmalert` alert rules in order to trigger alerts regarding the rule expression. For example:
```yaml
groups:
- name: vm-health
rules:
- alert: TooManyRestarts
expr: changes(process_start_time_seconds{job=~".*(victoriametrics|vmselect|vminsert|vmstorage|vmagent|vmalert|vmsingle|vmalertmanager|vmauth).*"}[2m]) > 2
labels:
severity: critical
annotations:
summary: "{{ $labels.job }} too many restarts (instance {{ $labels.instance }})"
description: "Job {{ $labels.job }} (instance {{ $labels.instance }}) has restarted more than twice in the last 15 minutes.
It might be crashlooping."
```
2. Configure `vmalert`:
```sh
./bin/vmalert -rule=alert.rules \ # Path to the file with rules configuration. Supports wildcard
-datasource.url=http://localhost:8428 \ # Prometheus HTTP API compatible datasource
-notifier.url=http://localhost:9093 \ # AlertManager URL (required if alerting rules are used)
-notifier.url=http://127.0.0.1:9093 \ # AlertManager replica URL
-remoteWrite.url=http://localhost:8428 \ # Remote write compatible storage to persist rules and alerts state info (required if recording rules are used)
-remoteRead.url=http://localhost:8428 \ # Prometheus HTTP API compatible datasource to restore alerts state from
-external.label=cluster=east-1 \ # External label to be applied for each rule
-external.label=replica=a # Multiple external labels may be set
```
## FAQ
**Will alerts in ilert be resolved automatically?**
Yes, as soon as the Alertmanager sends a "RESOLVE" event, the associated alert is automatically resolved in ilert.
---
# Agent Instructions
This documentation is published with GitBook. GitBook is the documentation platform designed so that both humans and AI agents can read, navigate, and reason over technical content effectively. Learn more at gitbook.com.
## Querying This Documentation
If you need additional information that is not directly available in this page, you can query the documentation by asking a question.
Perform an HTTP GET request on the following URL with the `ask` and `goal` query parameters:
```
GET https://docs.ilert.com/integrations/inbound-integrations/victoria-metrics.md?ask=&goal=
```
`ask` is the immediate question: it should be specific, self-contained, and written in natural language.
`goal` is what the user is ultimately trying to achieve, the reason they need the answer. Sharing it helps GitBook give you a better, more relevant answer. A goal is most helpful when it describes the outcome the user wants rather than restating the question. For example, with `ask=how do I create an API token`, a goal like `automate deployments from our CI pipeline` lets GitBook tailor the answer to that use case.
The response will contain a direct answer to the question and relevant excerpts and sources from the documentation.
Use this mechanism when the answer is not explicitly present in the current page, you need clarification or additional context, or you want to retrieve related documentation sections.